3D Scanner Day 1-2
Goal: Build a 3D scanner.
-
Explore Arduino, Stepper Motors, Sensors, Math, and CAD
-
How Should I read a report?
-
How should I implement math to tune my data
-
What should I do with a 3D scanner?
-
What limitations do I have?
Day 1: Analog distance sensing
What is Analog vs Digital?
Analog Sensing:
- Produces continuous data that varies smoothly over (T)ime.
- NO DATA DELAY
- Directly reflects the data:
- Output voltage/current changes proportionally with the measured quantity.
However, since for most digital systems, it can only understand 1 or 0, or True / False. It needs a convertor.
1 | Requires analog-to-digital conversion for digital systems |
Digital Sensing:
- Produces discrete signals. BINARY
- Output is quantized into steps
- Yet, contain some latency.
How does Binary system work?
Normally, if we look at 1234.5 we can dissect it into:
1234.5 = 1000 + 200 + 30 + 4 + 0.5.
Now in BINARY each position represent a power of 2.
| Position | 2⁷ | 2⁶ | 2⁵ | 2⁴ | 2³ | 2² | 2¹ | 2⁰ |
|---|---|---|---|---|---|---|---|---|
| Value | 128 | 64 | 32 | 16 | 8 | 4 | 2 | 1 |
Now Let try to Convert 1234 into Binary
1 | 1234: |
1 | Let Convert 11,111,111 into decimal: |
Arduino Analog Set-Up:
I am referencing these websites:
Video Explaining Stepper Motor:
Arduino Docs
Based on Arduino Docs:
An Arduino UNO, for example, contains a multichannel, 10-bit analog to digital converter (ADC). This means that it will map input voltages between 0 and the operating voltage (+5 VDC) into integer values between 0 and 1023. This yields a resolution between readings of: 5 volts / 1024 units or 0.0049 volts (4.9 mV) per unit.
The voltage input range can be changed using analogReference(). The default analogRead() resolution on Arduino boards is set to 10 bits, for compatibility. You need to use analogReadResolution() to change it to a higher resolution.
Why does it matter?
What does “10-bit” mean?
-
10-bit means you have 10 binary digits (bits)
-
The smallest value: 0000000000 = 0
-
The largest value: 1111111111 = 1023
-
Total possible values: 2^10 = 1024 values (0 through 1023)
ADC:
The Arduino can take an analog voltage and convert it to a digital number.
YET:
It uses 10BITS to convert this number, and it can only map “volatges between 0~5Volts”.
So:
- If you have 2.5 V, you get 1000000000, or 512 in decimal.
- Digital Value = (Input Voltage / 5V) × 1023
HOWEVER:
LIMITATIONS:
It cannot be as detailed as you want it to be.
In order to find the base unit, we do:
5V ÷ 1024 = 0.00488V ≈ 4.9mV
This means the Arduino cannot distinguish between 2.500V and 2.504V—they both read as the same digital value
Sample Code:
1 | int analogPin = A3; // potentiometer wiper (middle terminal) connected to analog pin 3 |
RAW ANALOG to VOLATGE:
1 | // Constants |
Day 2 SHARP Sensors:
So Before You connect the Sensors/ANYTHING Directly:
Remember:
| Servo Wire | Common Color | Connects To |
|---|---|---|
| Signal | Yellow / White / Orange | Arduino digital pin |
| VCC / +5V | Red | Arduino 5V pin (or external 5V supply) |
| GND | Brown / Black | Arduino GND |
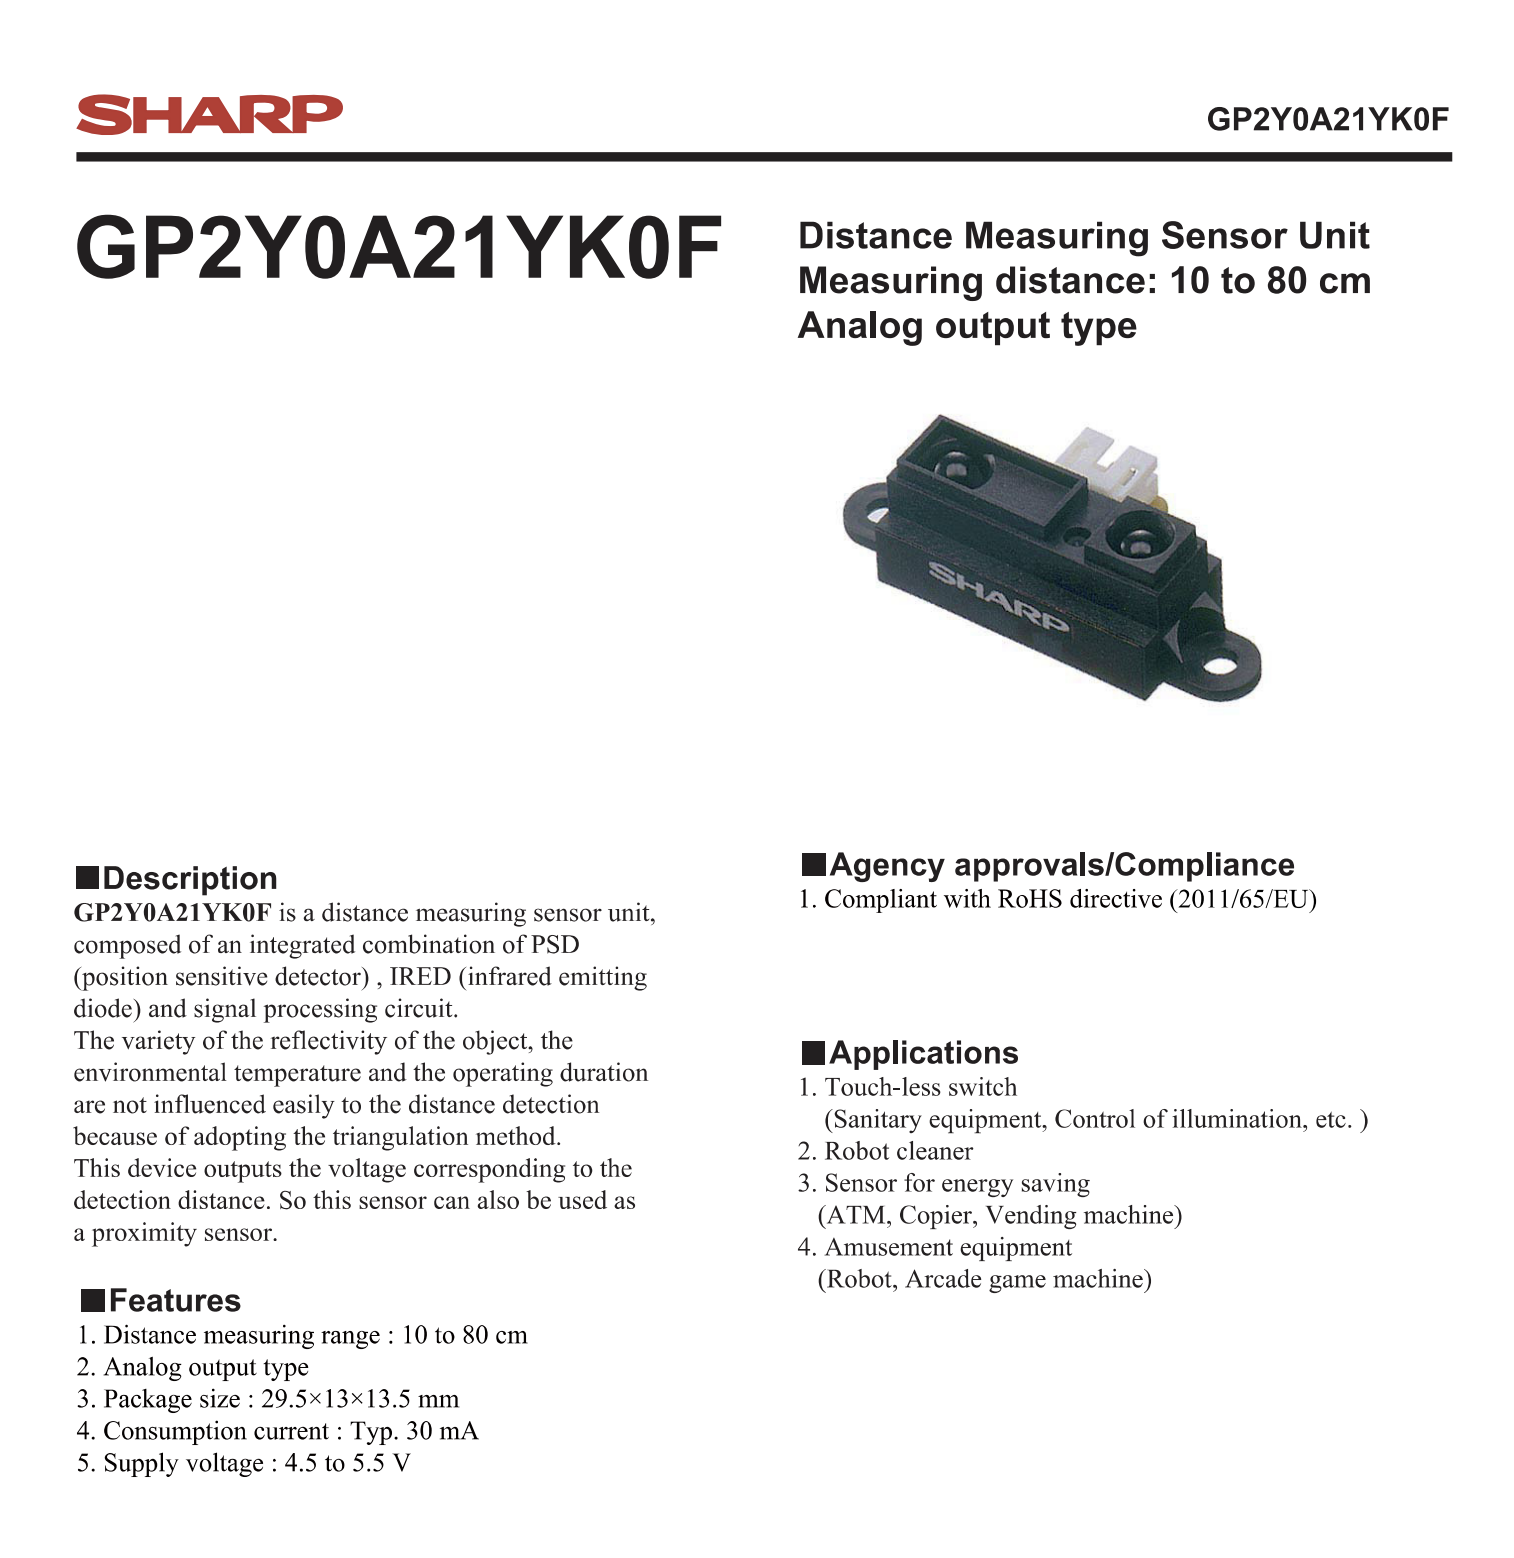
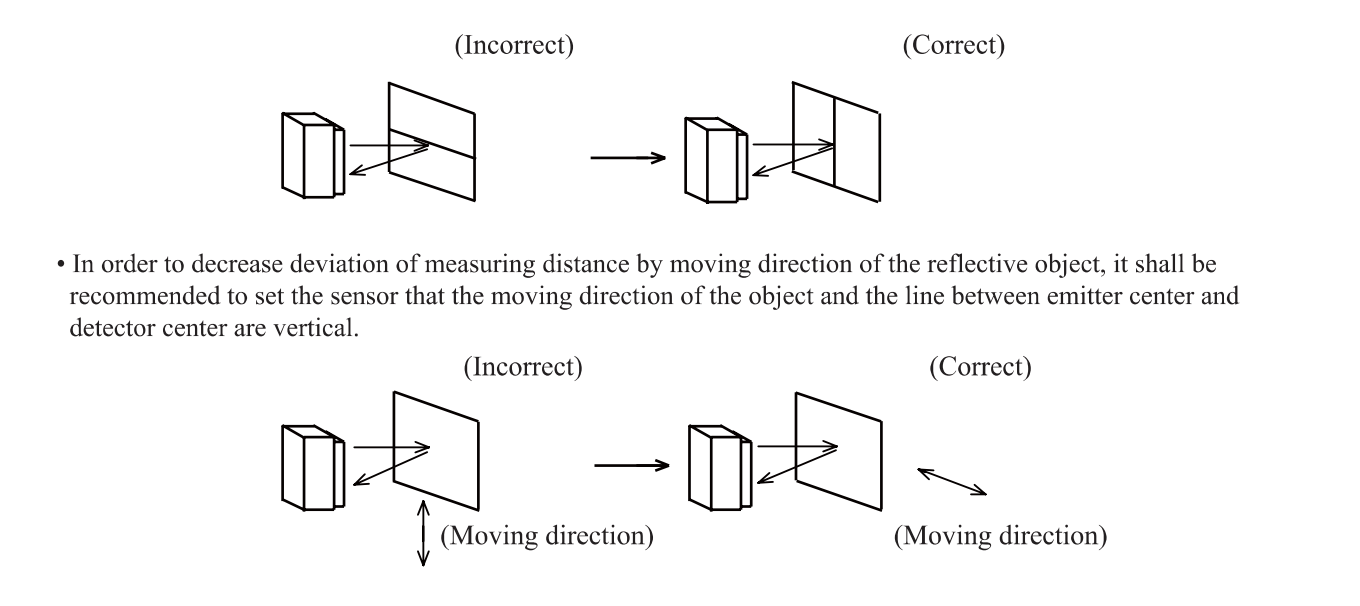
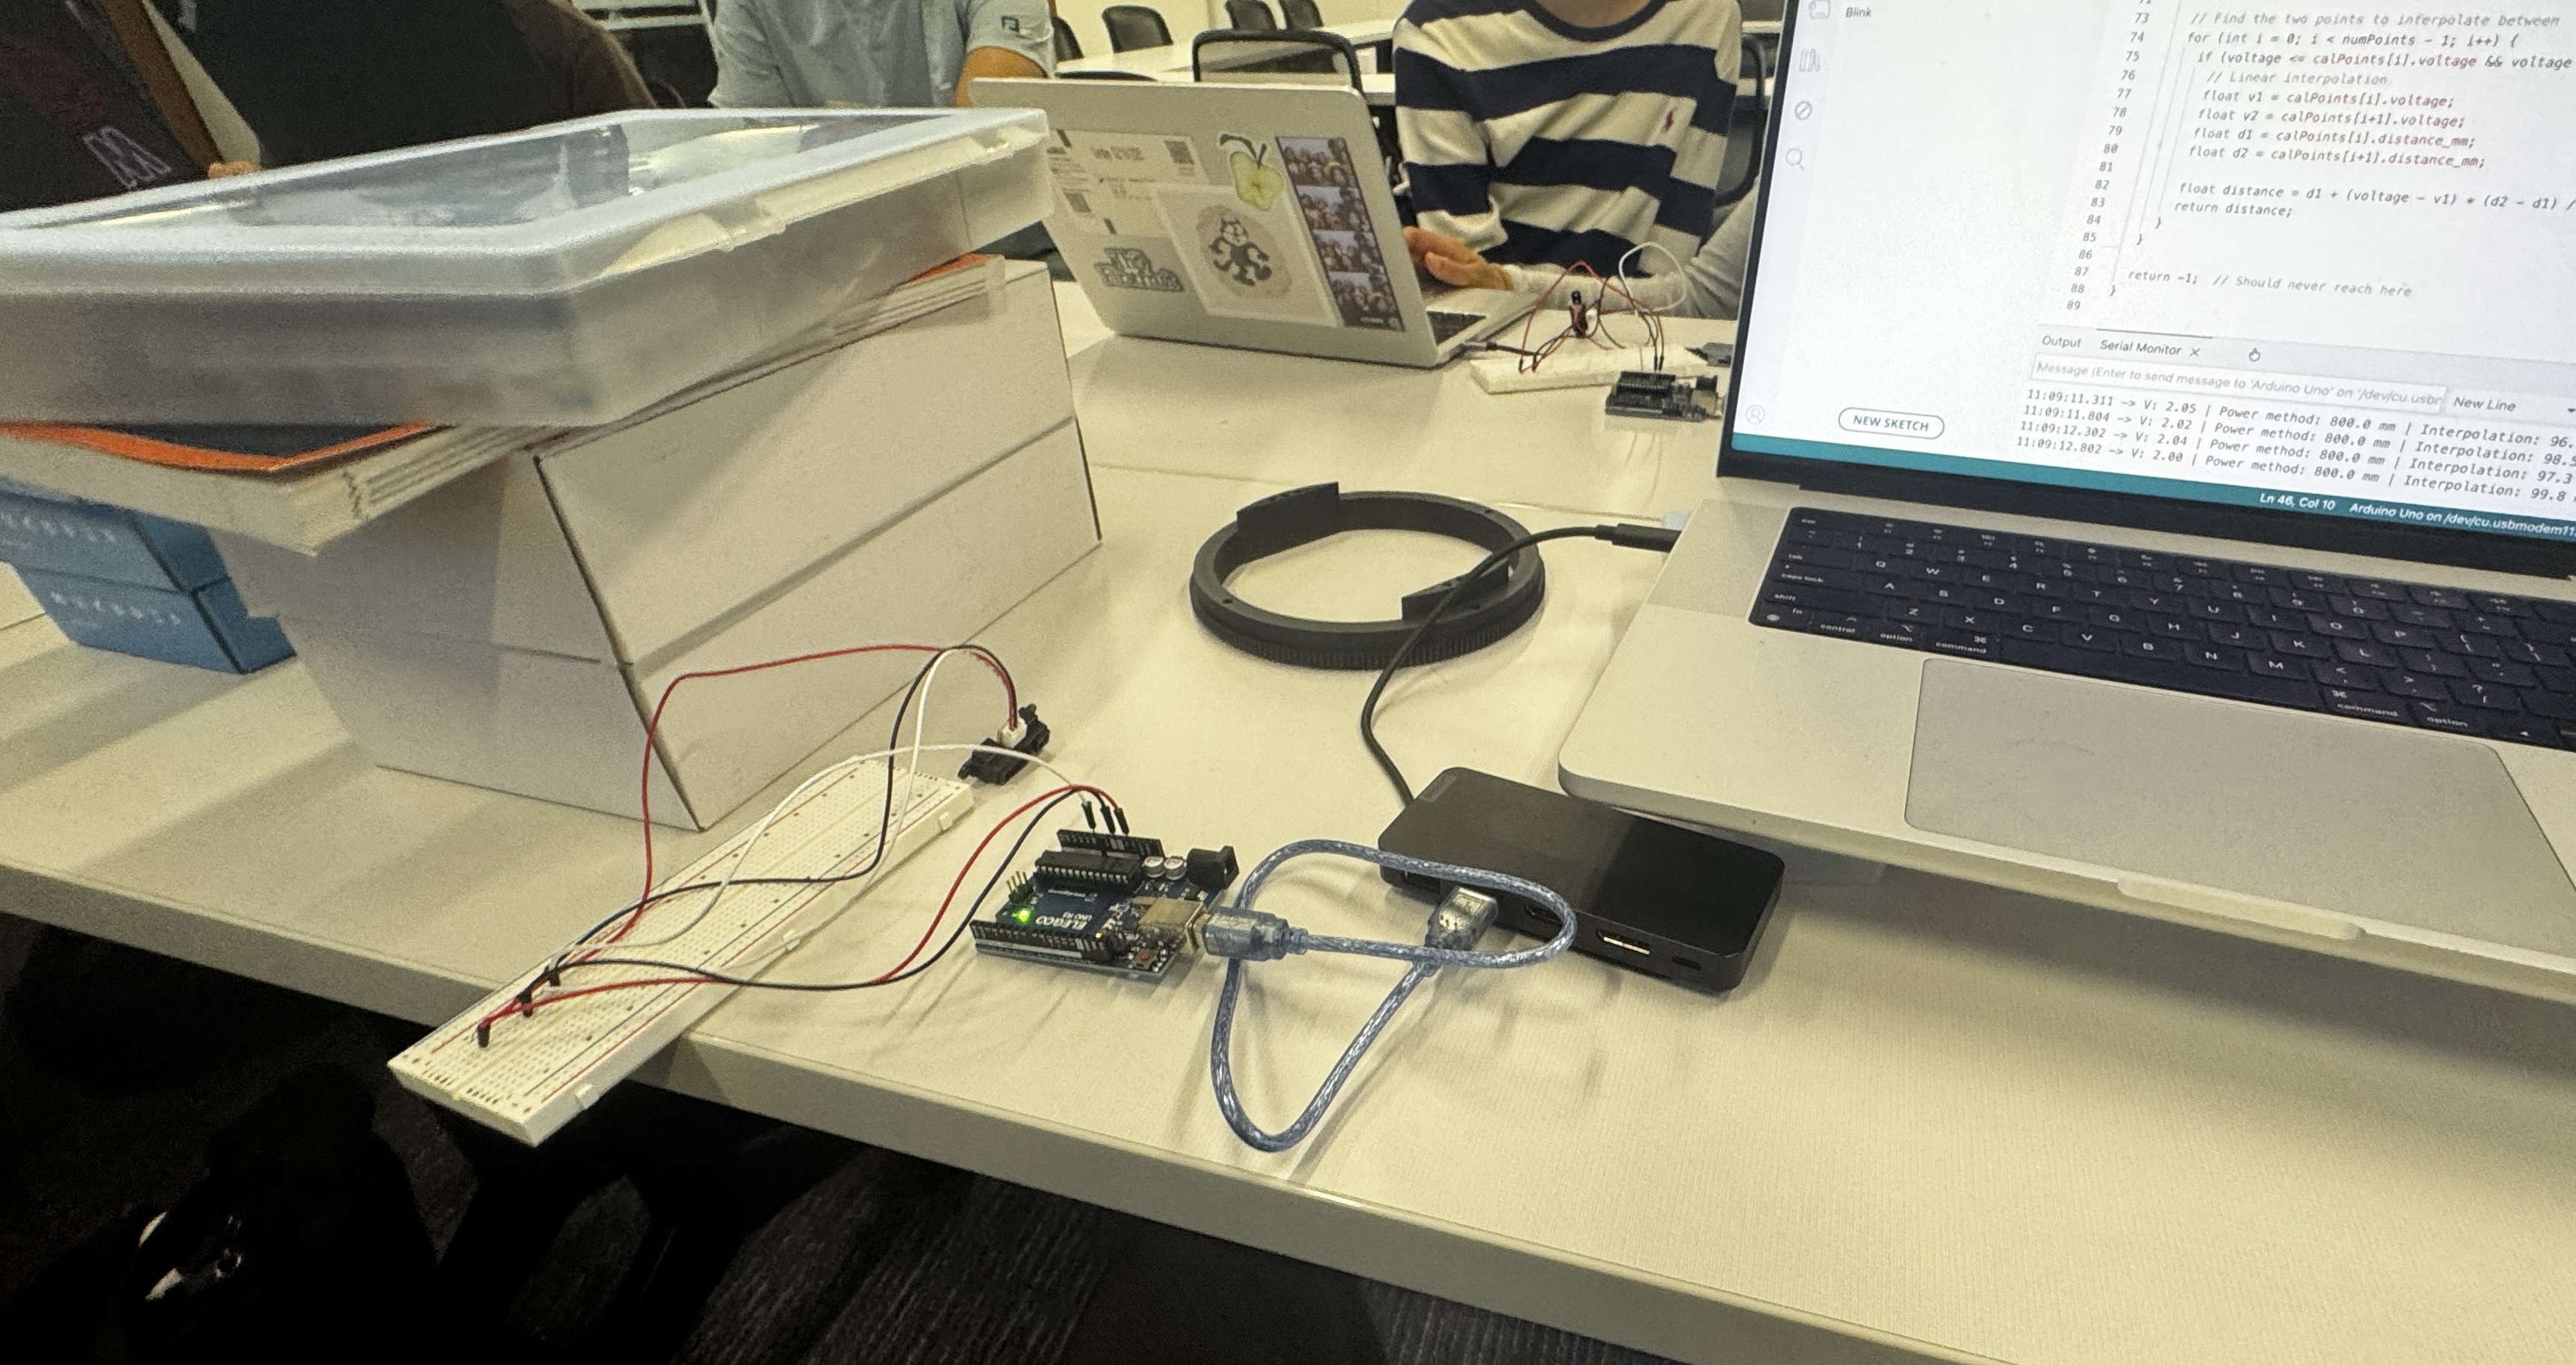
Observe these two Photos:
GP2Y0A21YK0F is an infrared (IR) distance sensor that:
- Measures distances from 10 to 80 cm
- Outputs an analog voltage (not digital)
- Uses IR triangulation
What is IR Triangulation?
Well, if you don’t know it, you 're in big trouble, that’s why our data never worked.
According to Claude:
1 | An IR LED emits a beam of infrared light. |
1 | Emitter → Object → Detector |
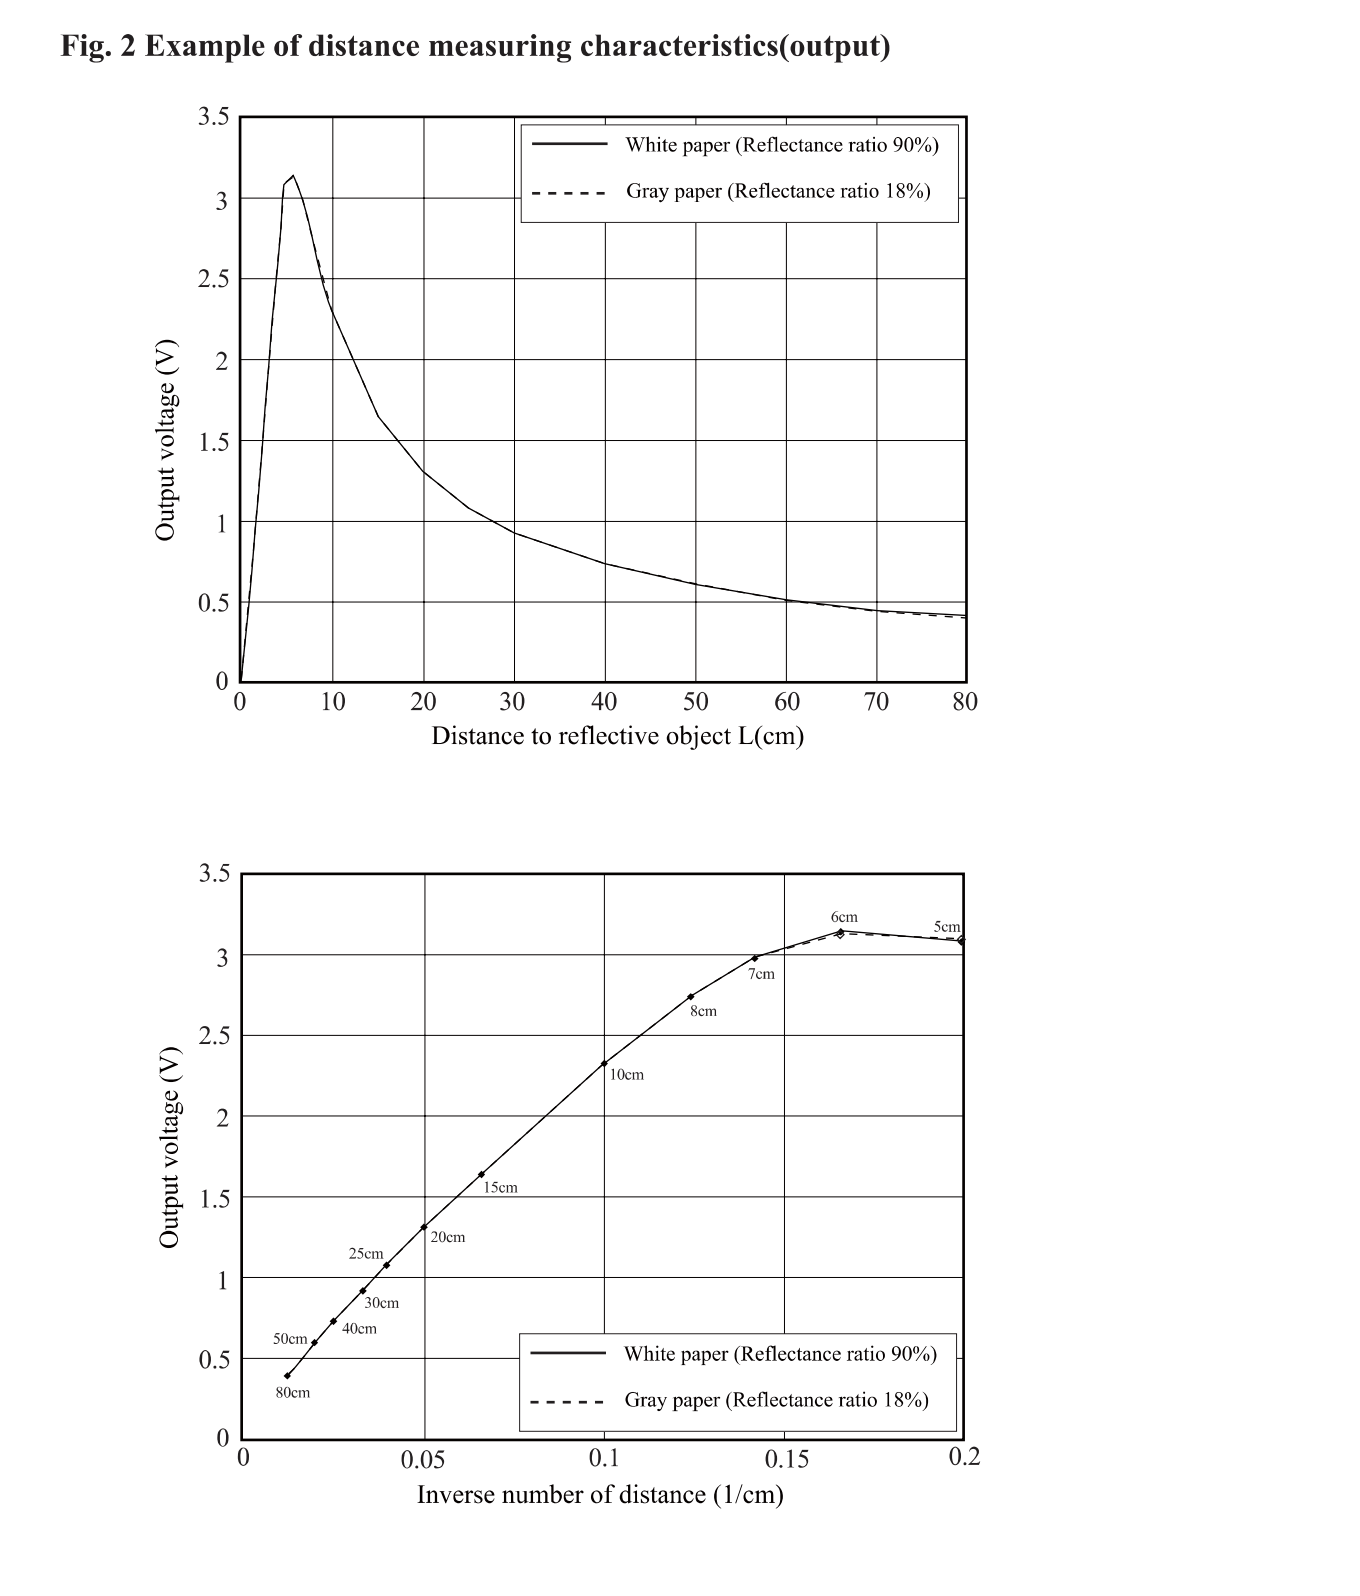
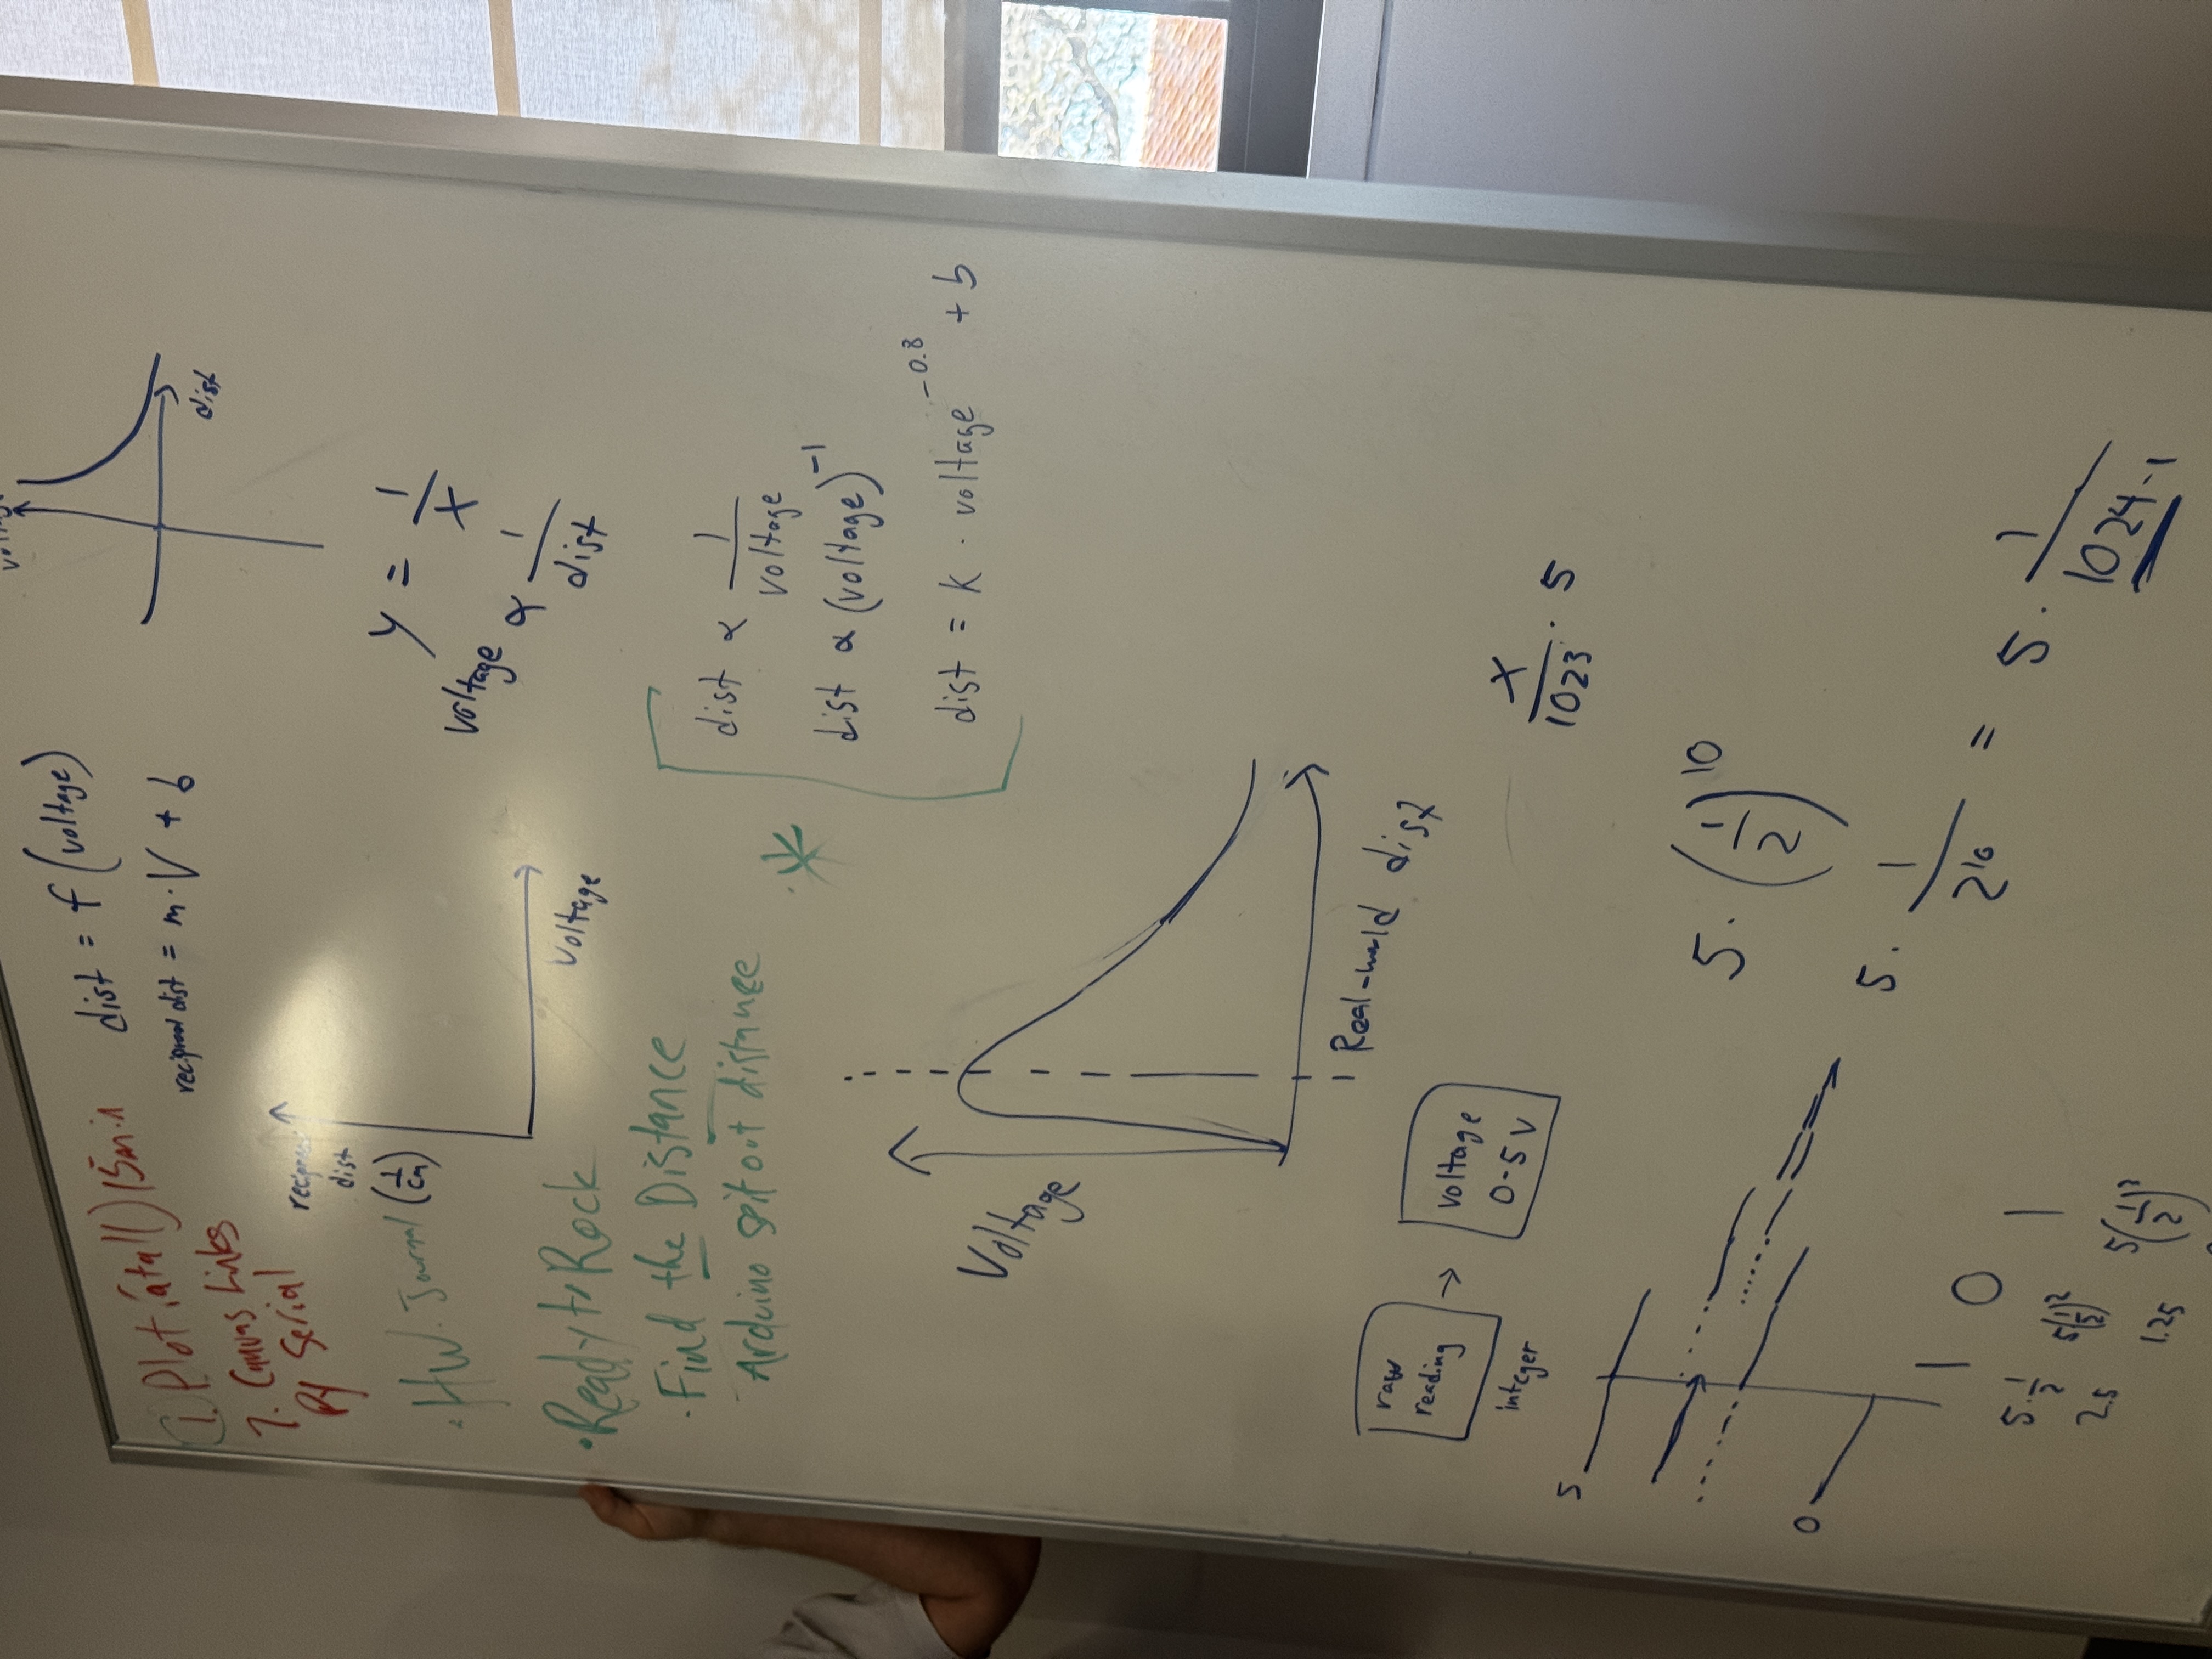
So, This is what we came up in class:
And Here are some interpretation of the Graph:
And here is my code Derived from the data.
Notice how the data starts at 10cm and ends at 80cm.
Before I show you the code:
I need to explain what is INTERPOLATION:
Interpolation: is estimating unknown values between known data points by assuming a straight line between them.
The math is here:
1 | distance = d1 + (voltage - v1) * (d2 - d1) / (v2 - v1) |
1 | // Calibration version - measure at known distances |
And we based our measured data of the given sample graph.
And Here is a comparison of the real data:
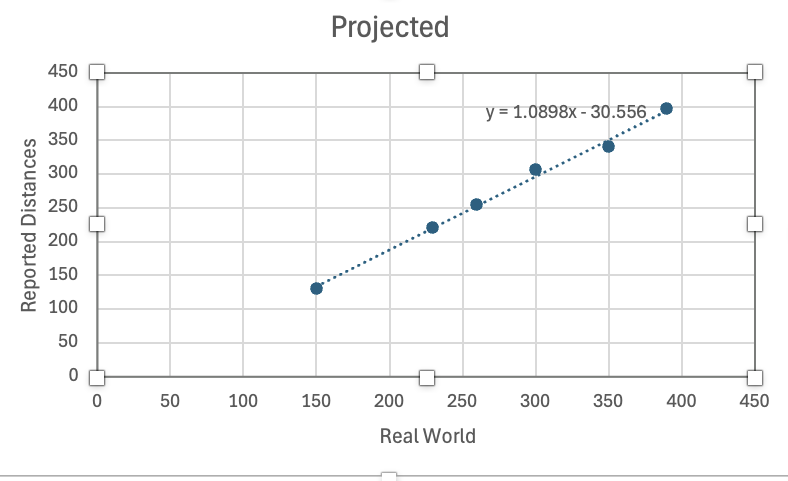
I mean, in order to improve this next line,
We should first test the basic data and find an exponential regression by plotting it on Desmos to obtain a well-Tuned data.
Also Here are some advice to avoid errors: