3D Scanner Day 1-2
Goal: Build a 3D scanner.
What I need to explore: Arduino, Stepper Motors, Sensors, Math, and CAD.
Questions I’m asking myself:
- How should I read a datasheet?
- How should I use math to tune my data?
- What should I actually do with a 3D scanner?
- What are my limitations?
Day 1: Analog distance sensing
First question: what is Analog vs Digital?
Analog Sensing:
- Produces continuous data that varies smoothly over (T)ime.
- No conversion delay — the signal is “live.”
- Directly reflects the measurement: the output voltage/current changes proportionally with the measured quantity.
The catch: most digital systems only understand 1 or 0 — True / False — so an analog signal needs a converter before they can read it.
1 | Requires analog-to-digital conversion for digital systems |
Digital Sensing:
- Produces discrete signals — BINARY.
- The output is quantized into fixed steps.
- The trade-off: it carries some latency.
How does the binary system work?
We read decimal numbers by place value. For example, 1234.5 breaks down as:
1234.5 = 1000 + 200 + 30 + 4 + 0.5
BINARY works the same way — except each position is a power of 2 instead of 10:
| Position | 2⁷ | 2⁶ | 2⁵ | 2⁴ | 2³ | 2² | 2¹ | 2⁰ |
|---|---|---|---|---|---|---|---|---|
| Value | 128 | 64 | 32 | 16 | 8 | 4 | 2 | 1 |
Now let’s try to convert 1234 into binary.
1 | 1234: |
1 | Now the other way — let's convert the binary number 11111111 back into decimal: |
Arduino Analog Set-Up
Here are the datasheets and references I leaned on for the whole build:
And a video that explains stepper motors (we’ll lean on it again later):
Arduino Docs
Based on Arduino Docs:
An Arduino UNO, for example, contains a multichannel, 10-bit analog to digital converter (ADC). This means that it will map input voltages between 0 and the operating voltage (+5 VDC) into integer values between 0 and 1023. This yields a resolution between readings of: 5 volts / 1024 units or 0.0049 volts (4.9 mV) per unit.
The voltage input range can be changed using analogReference(). The default analogRead() resolution on Arduino boards is set to 10 bits, for compatibility. You need to use analogReadResolution() to change it to a higher resolution.
Why does it matter?
What does “10-bit” mean?
10-bit means you have 10 binary digits (bits)
The smallest value: 0000000000 = 0
The largest value: 1111111111 = 1023
Total possible values: 2^10 = 1024 values (0 through 1023)
ADC:
The Arduino can take an analog voltage and convert it to a digital number.
YET:
It uses 10 bits to convert this number, and it can only map “voltages between 0 and 5 volts.”
So:
- Digital Value = (Input Voltage / 5V) × 1023
- Example: 2.5 V gives about 512, which is 1000000000 in binary.
HOWEVER:
LIMITATIONS:
It can’t be as detailed as you’d like. To find the size of one step — the smallest voltage change it can detect — we do:
5V ÷ 1024 = 0.00488V ≈ 4.9mV
This means the Arduino cannot distinguish between 2.500V and 2.504V — they both read as the same digital value.
Sample Code
First, the simplest possible read — print the raw 0–1023 value straight from the pin:
1 | int analogPin = A3; // potentiometer wiper (middle terminal) connected to analog pin 3 |
Then convert that raw number into an actual voltage:
1 | // Constants |
Day 2: SHARP Sensors
Before you wire up the sensor — or ANYTHING — remember the standard 3-wire color code:
| Wire | Common Color | Connects To |
|---|---|---|
| Signal | Yellow / White / Orange | Arduino digital pin |
| VCC / +5V | Red | Arduino 5V pin (or external 5V supply) |
| GND | Brown / Black | Arduino GND |
Take a look at these two photos — the sensor itself, and the response curve from its datasheet:
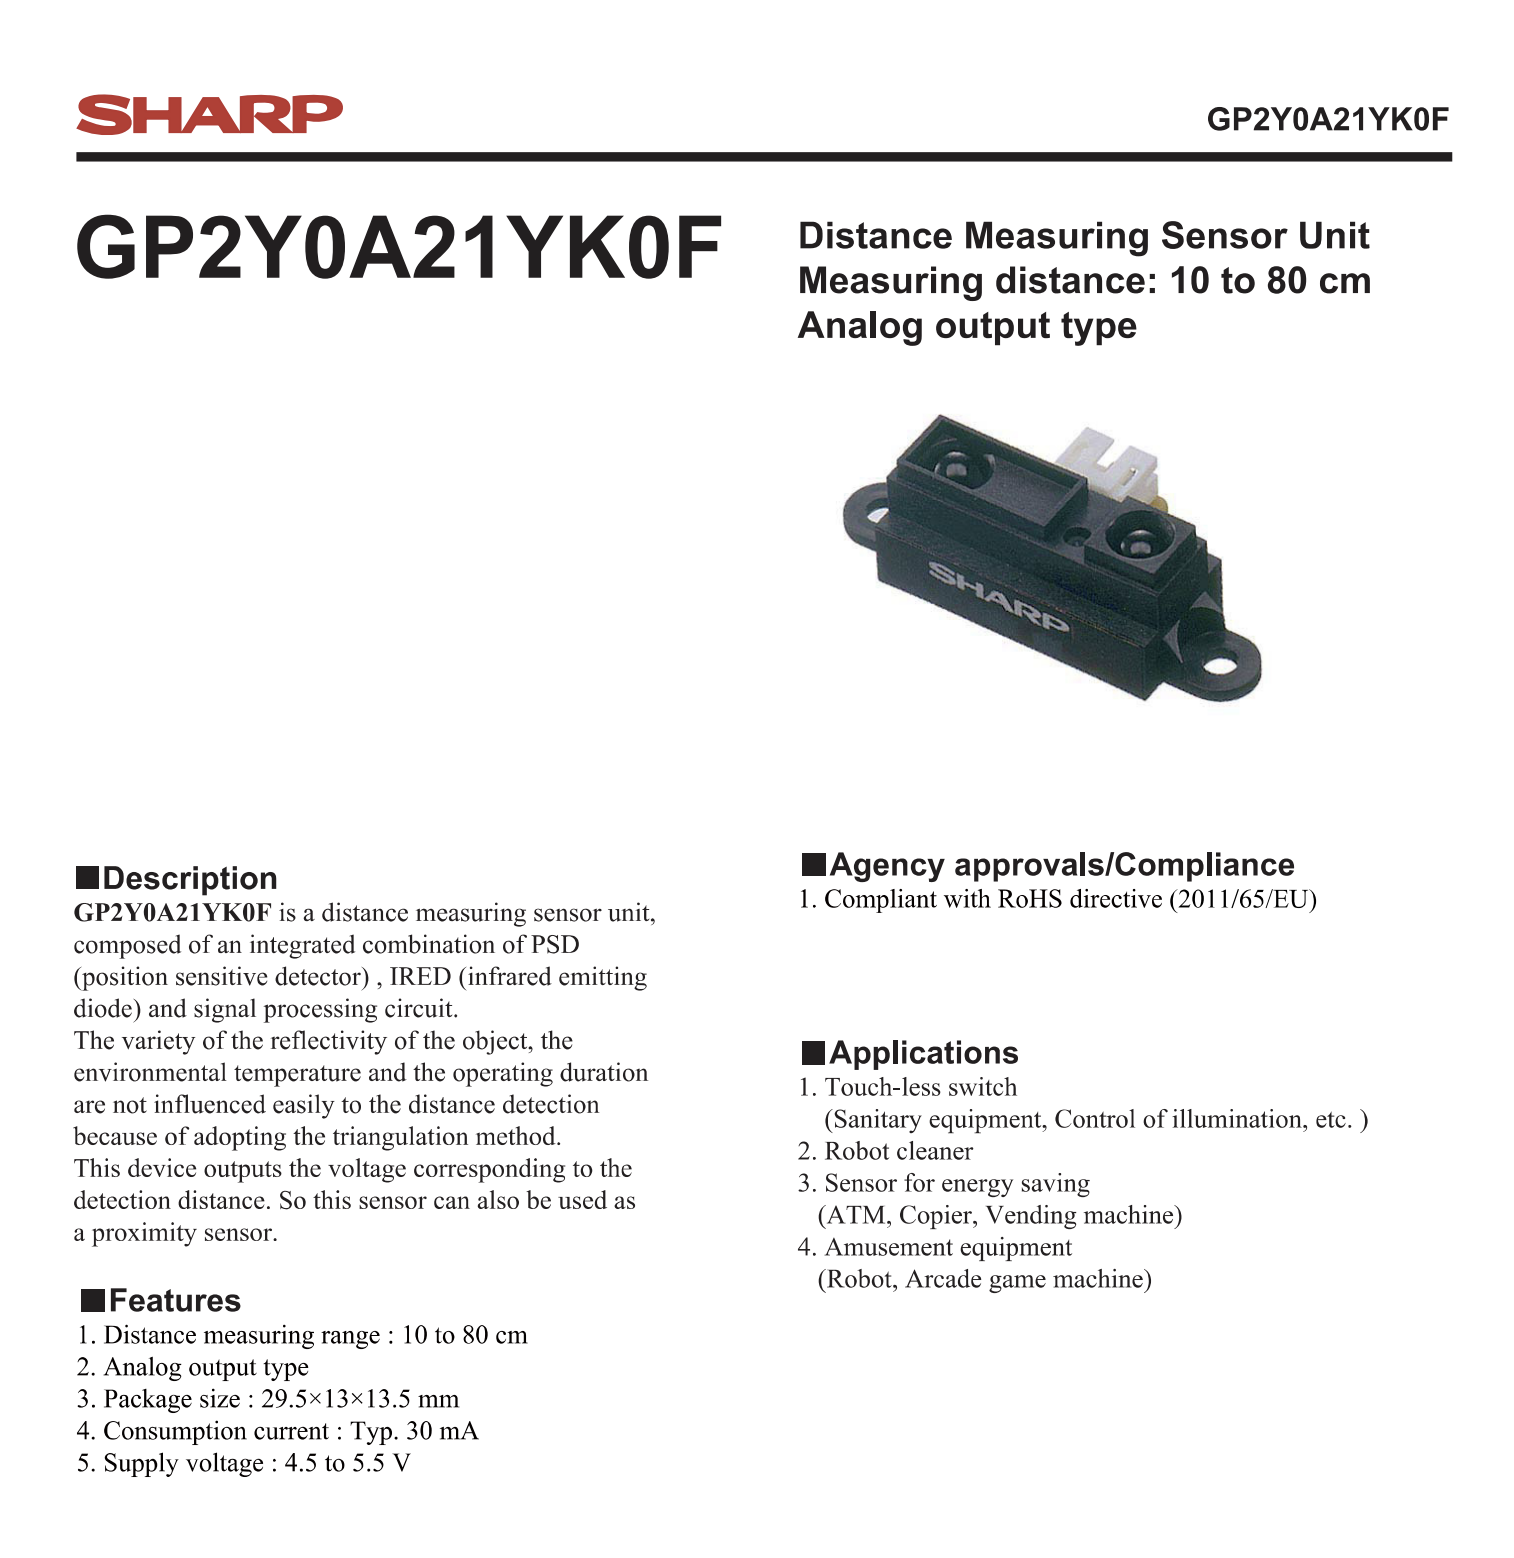
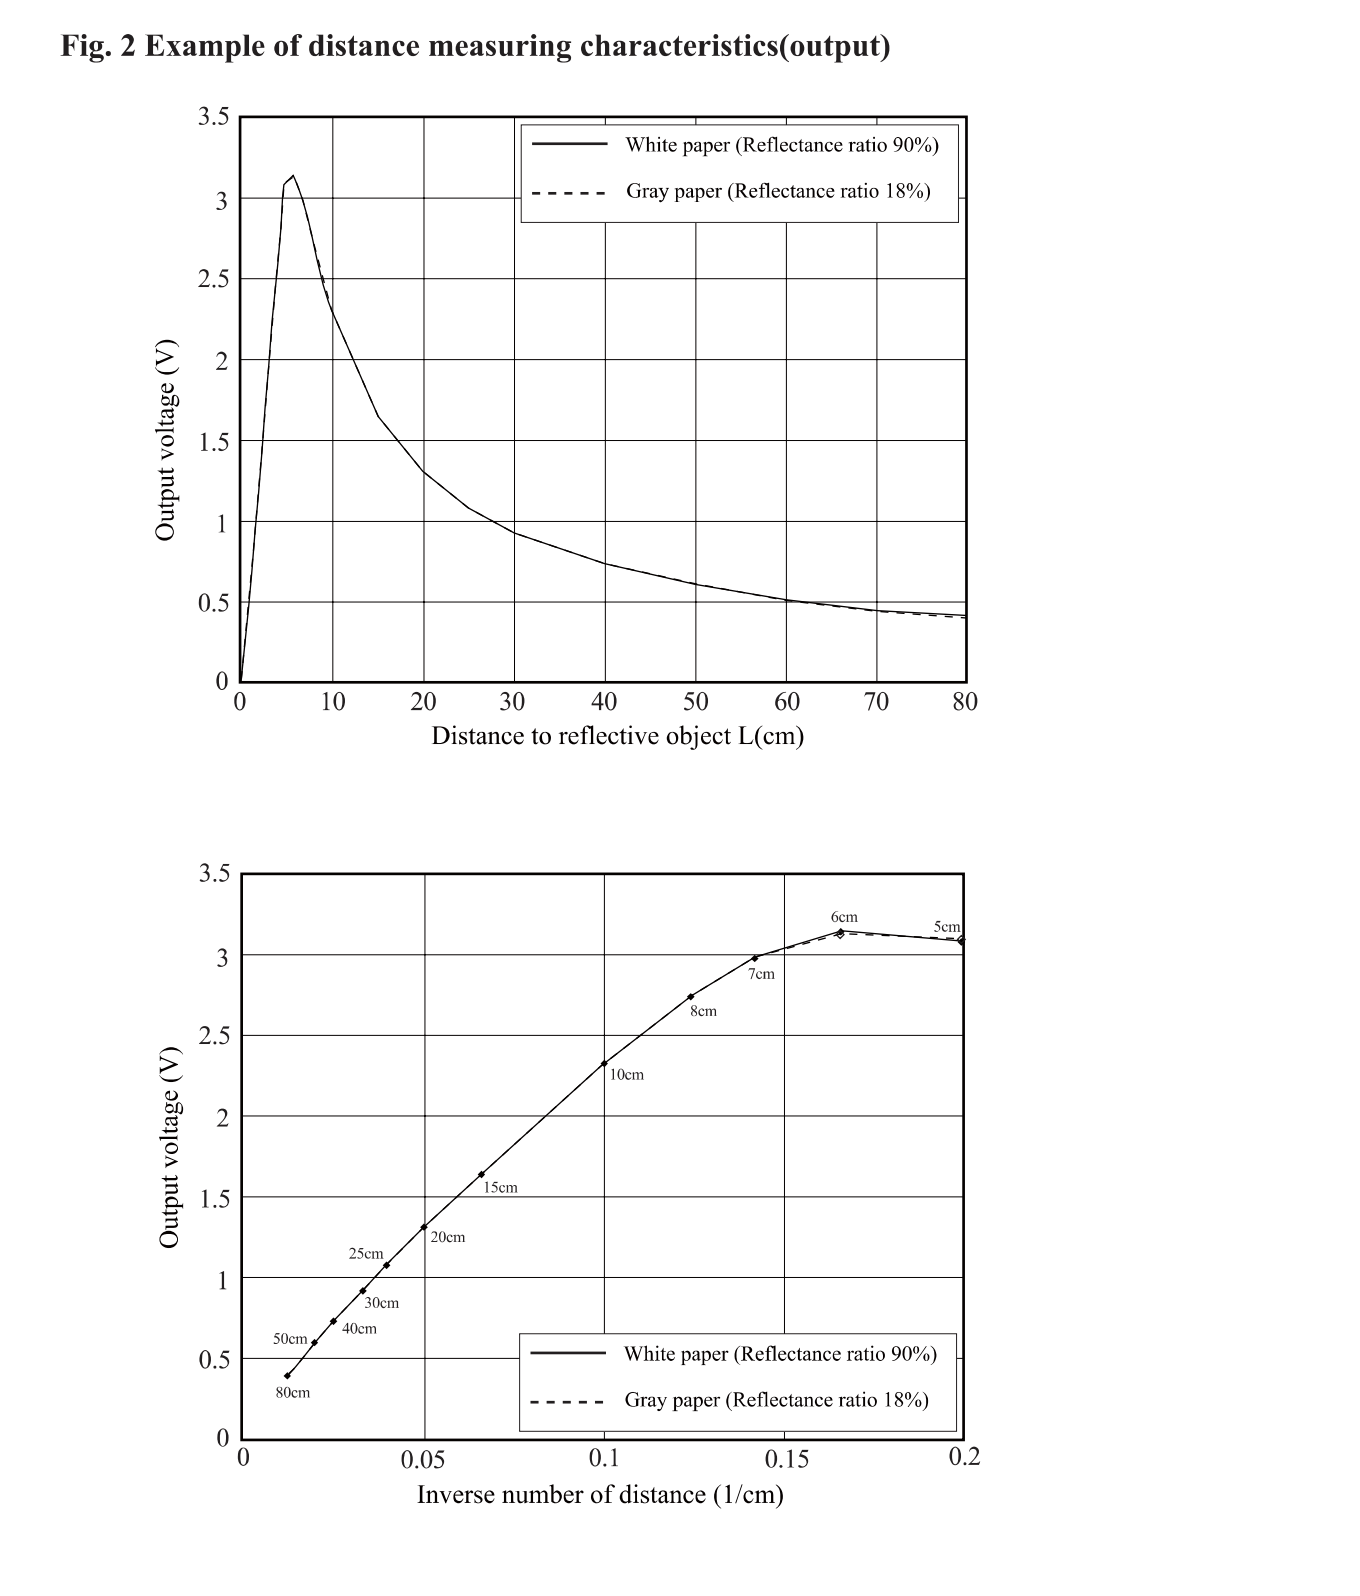
The GP2Y0A21YK0F is an infrared (IR) distance sensor that:
- Measures distances from 10 to 80 cm
- Outputs an analog voltage (not digital)
- Uses IR triangulation
What is IR Triangulation?
Well, if you don’t know it, you’re in big trouble; that’s why our data never worked.
According to Claude:
1 | An IR LED emits a beam of infrared light. |
1 | Emitter → Object → Detector |
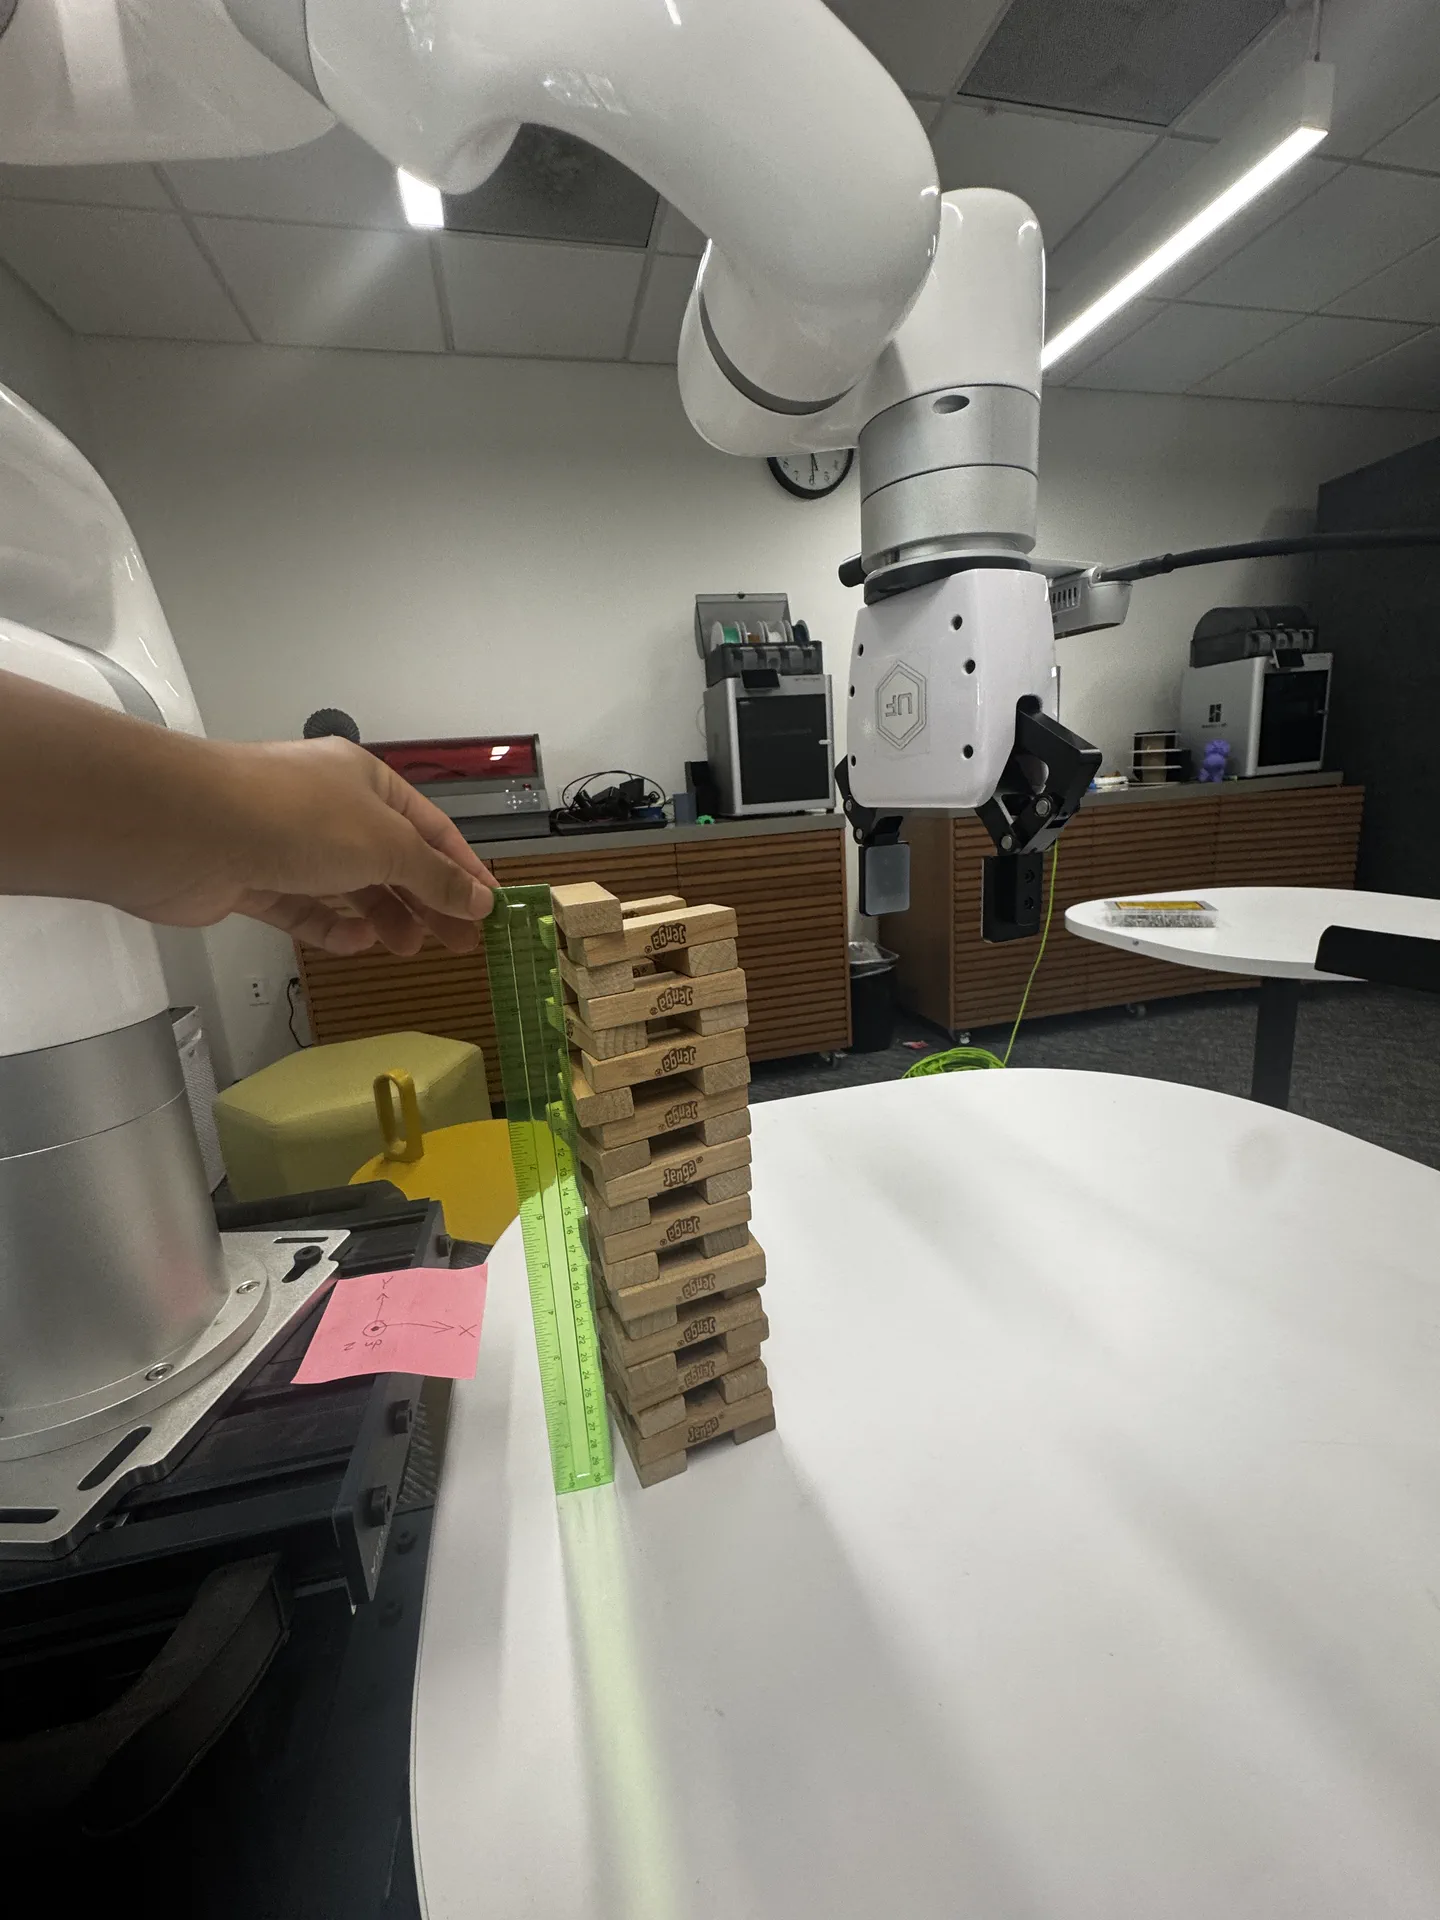
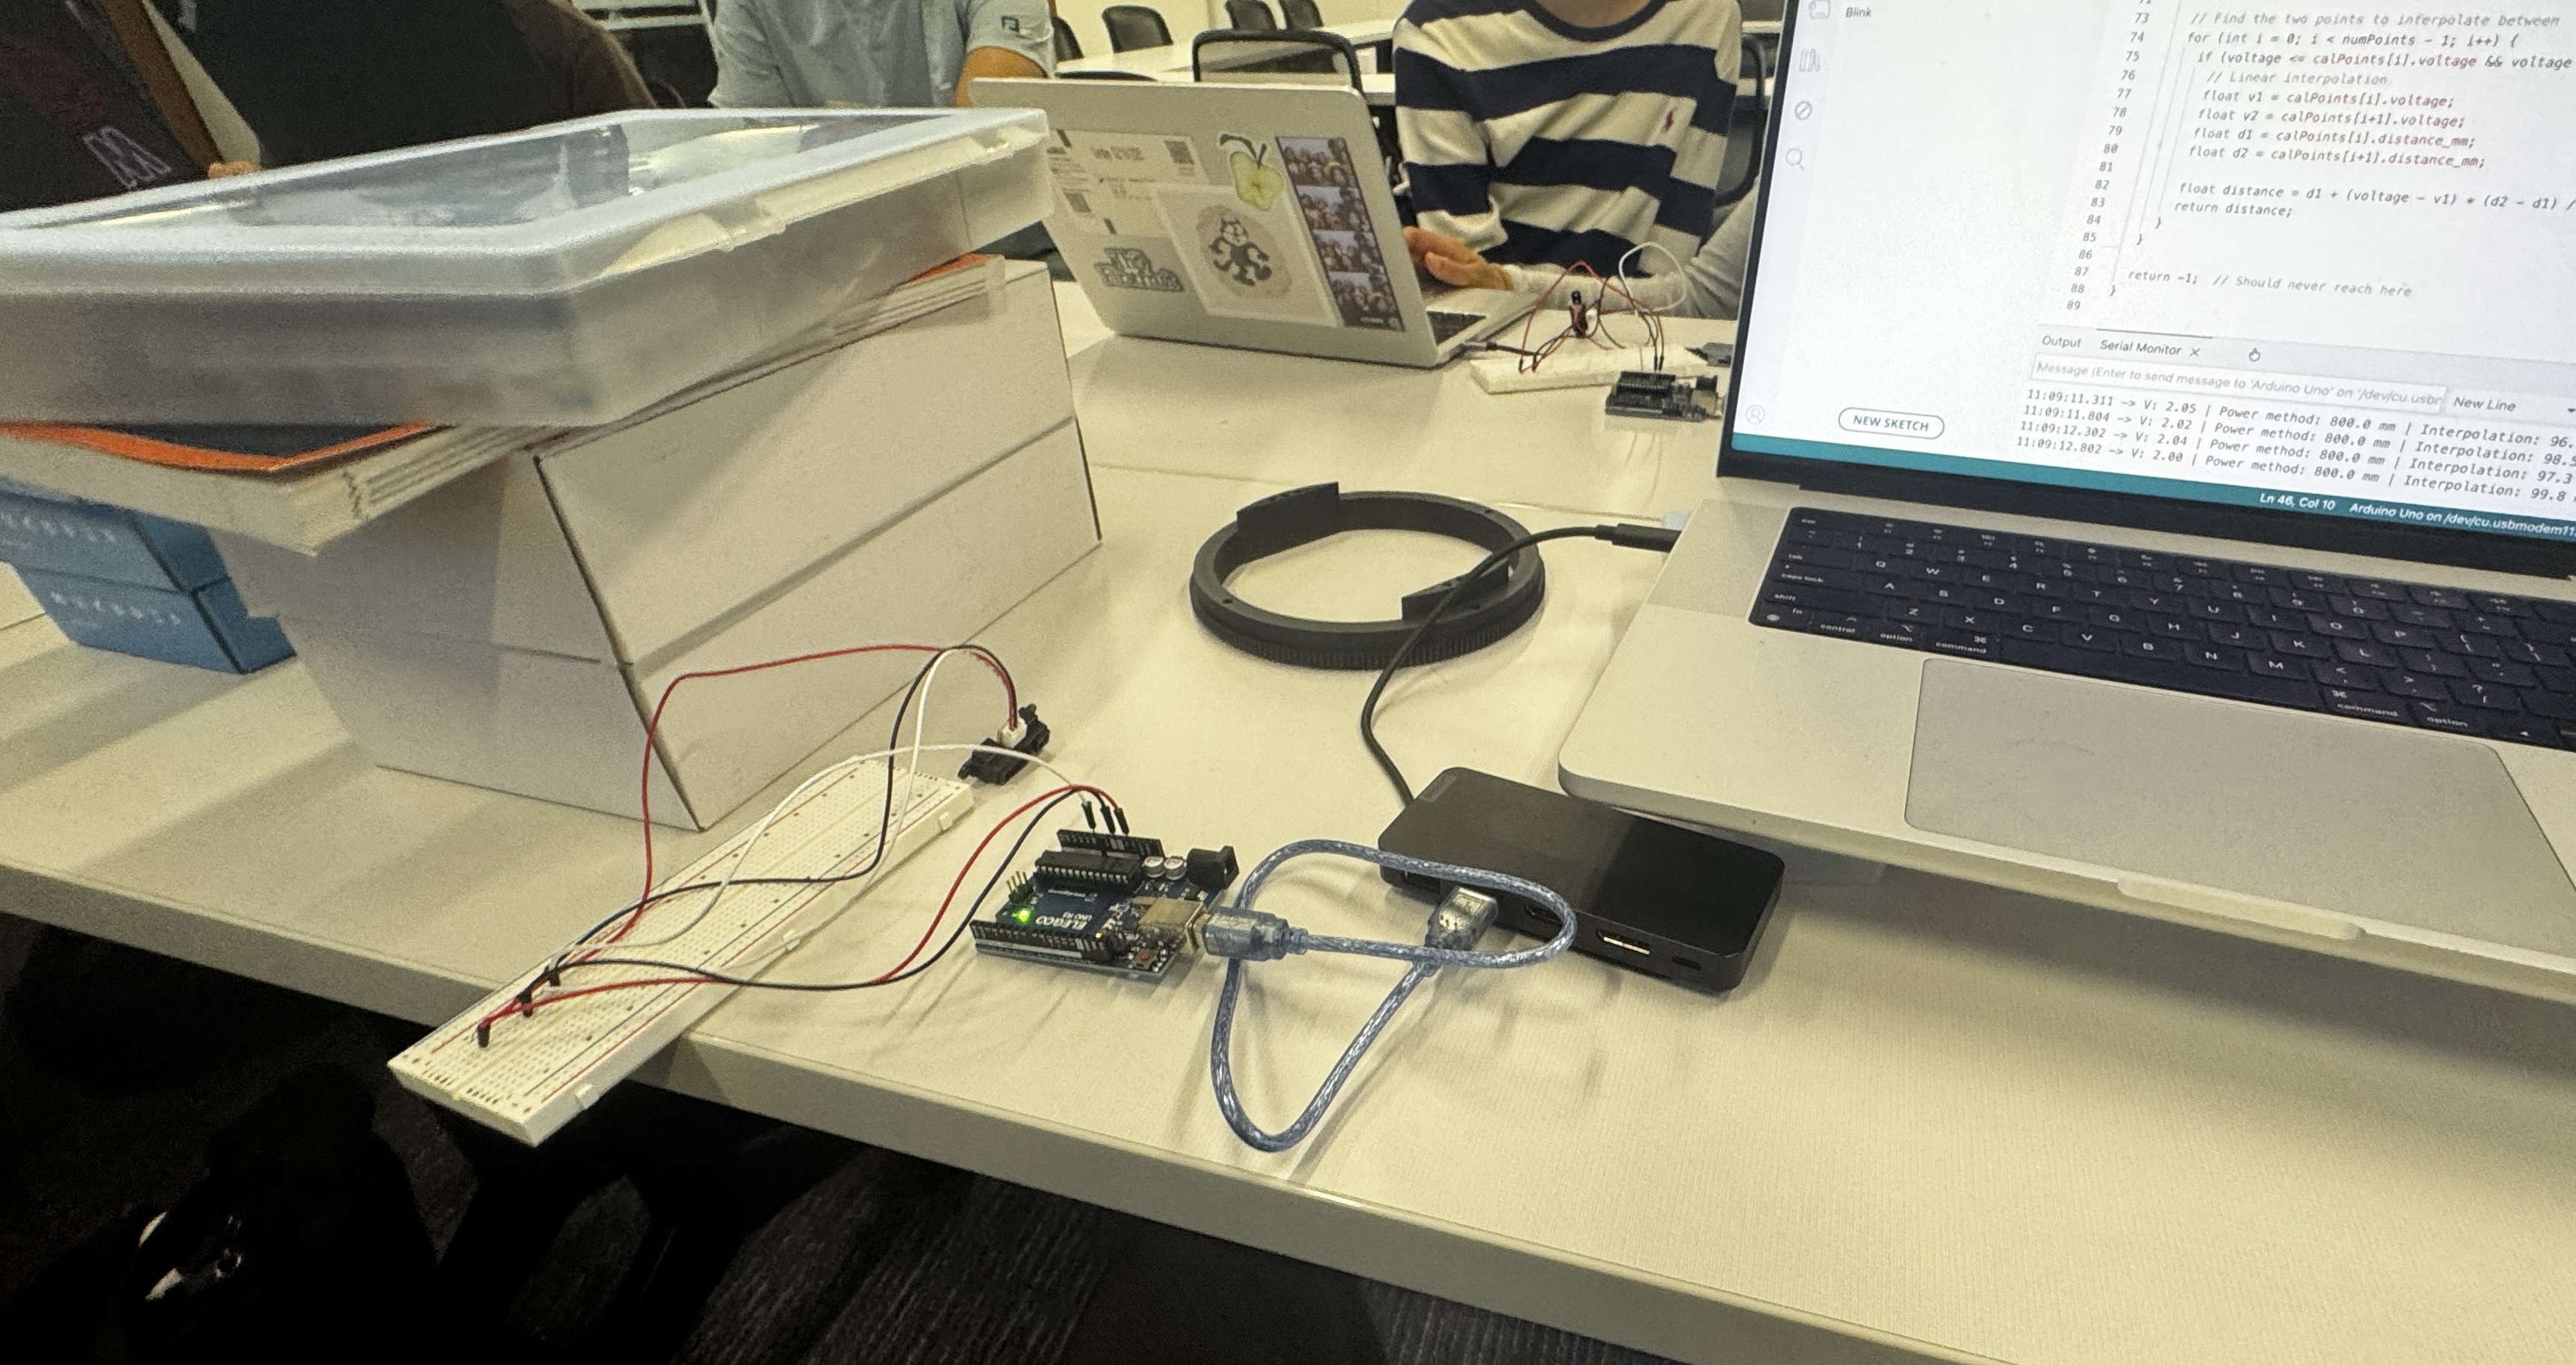
Here’s the setup we came up with in class:
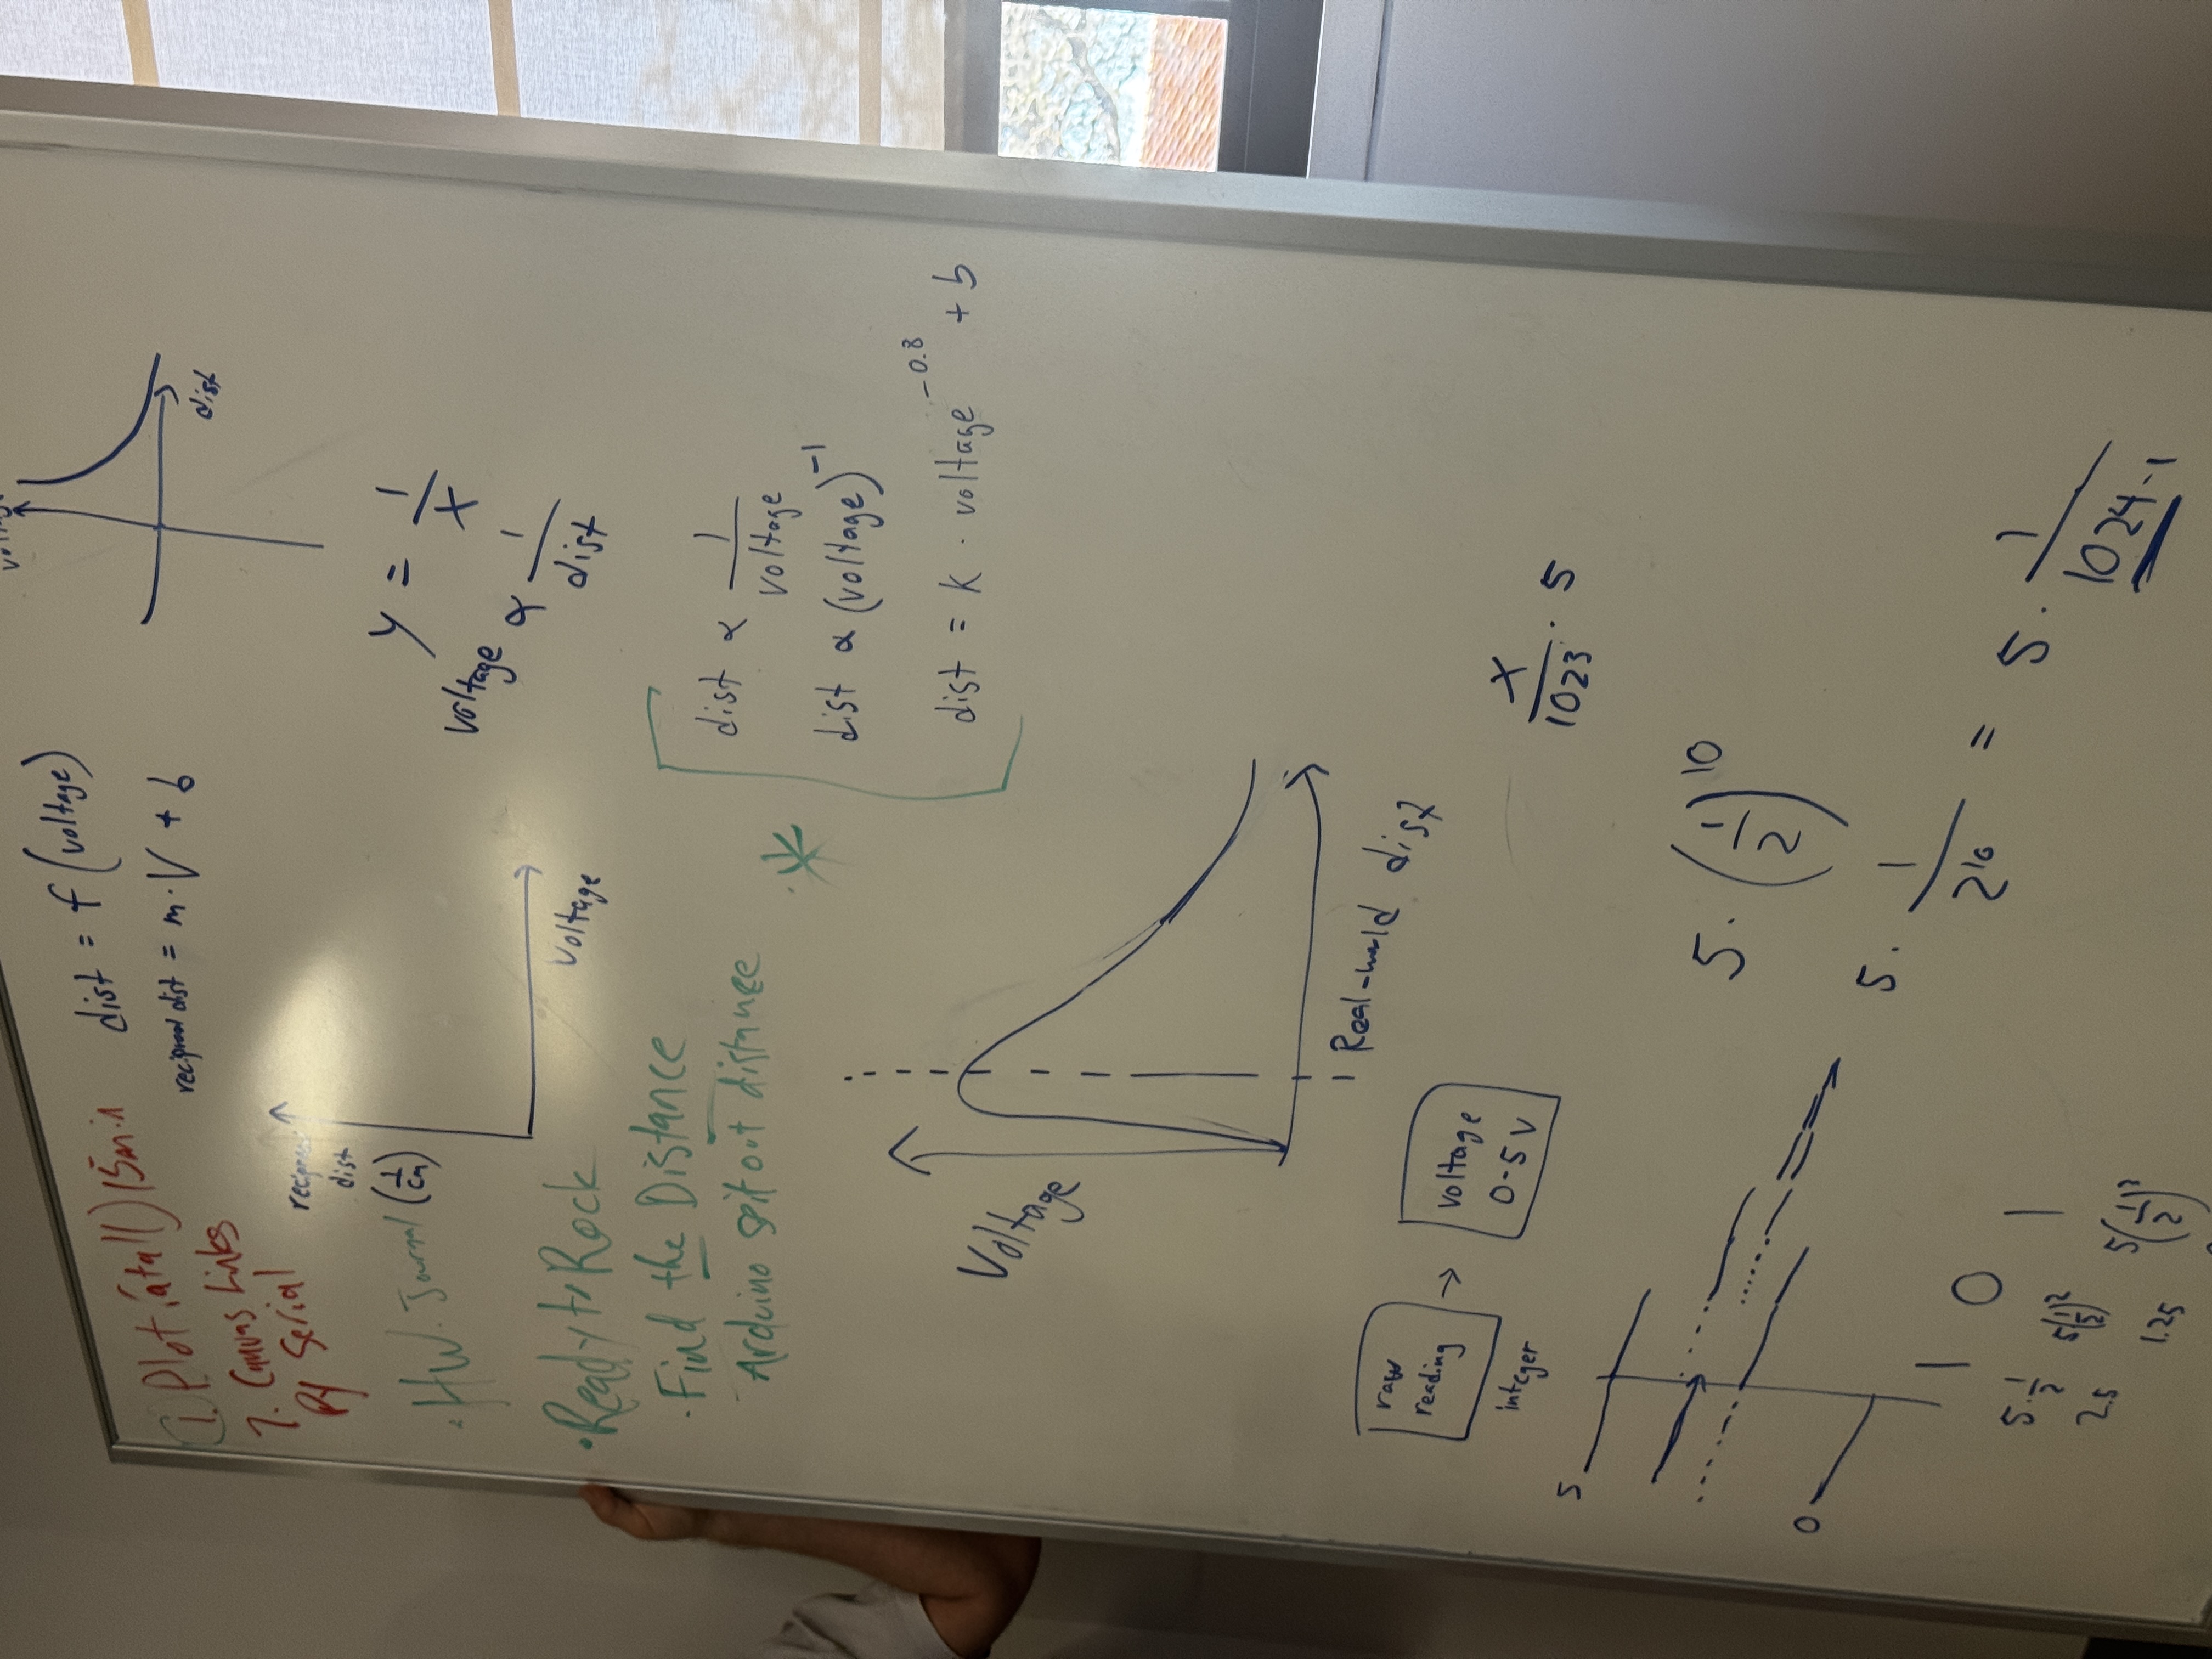
And here’s how we read the graph:
Before the code, one idea you need: INTERPOLATION.
Interpolation is estimating unknown values between two known data points by assuming a straight line between them. The math:
1 | distance = d1 + (voltage - v1) * (d2 - d1) / (v2 - v1) |
Here is my code, derived from that data — notice the readings run from 10 cm to 80 cm:
1 | // Calibration version - measure at known distances |
We based our measured data on the sample graph from the datasheet.
Here is how it compares with the real readings:
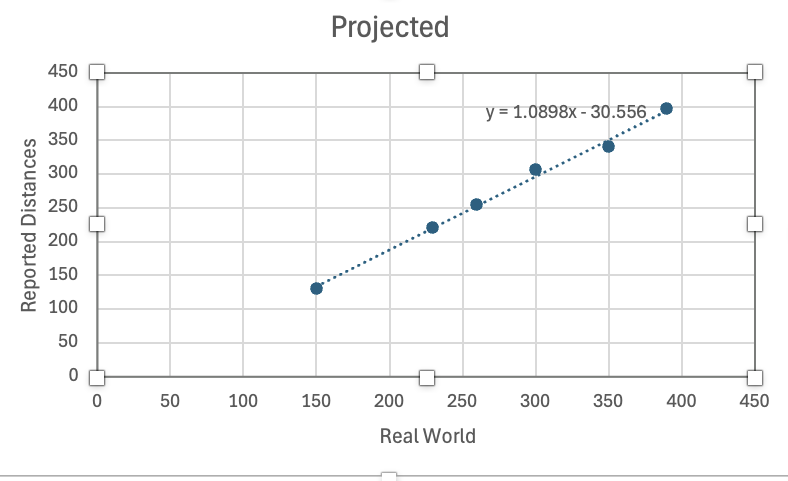
So how do we improve this? Next time, we should test the raw data first and fit an exponential regression in Desmos to get a properly tuned curve.
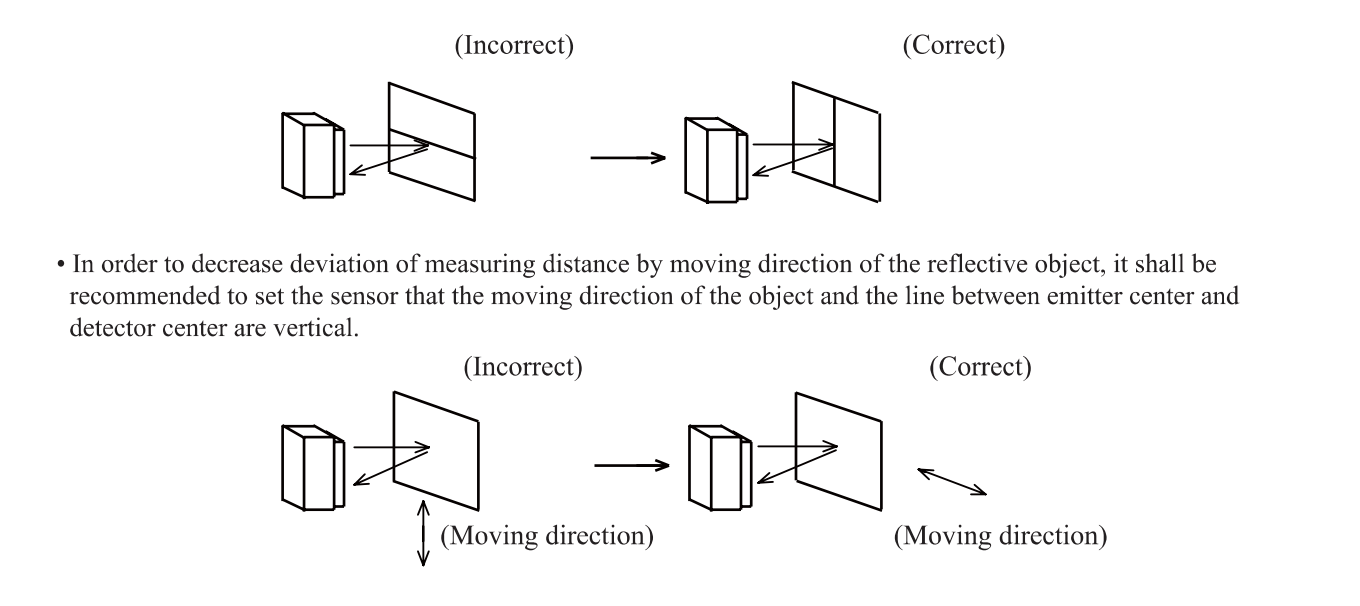
Also, here is some advice to avoid errors: