Visole
Visole
Thomas Li
The problem
Pain warns us when a shoe rubs or something presses into a foot. Diabetic neuropathy
takes that warning away. Someone can carry a high-pressure spot for weeks without feeling
it, while it damages the skin and tissue underneath.
That link is not a guess. In 1992 a team followed 86 diabetic patients for about 30
months and measured their peak plantar pressures at the start.
Clinicians act on this already. The current international guideline puts pressure relief
at the centre of treatment rather than at the edge of it.
So to help someone, a clinic has to find where the pressure sits, capture the shape of the
foot, design an insert, and make it. In 2025 a team asked all 214 NHS trusts and health
boards how they actually run that process. 131 answers made it into the analysis.
The design software is not the bottleneck. Everything upstream of it is.
The question
Can a camera look at a bare foot and tell where the pressure is?
That splits into three questions I can test:
- Can ordinary video of a foot show where load concentrates?
- Can I check that estimate against a real pressure sensor?
- Can I use the estimate to print a lattice insole that lowers a hotspot more than a
uniform lattice does?
This is an engineering study, not a medical device. I will not use it to diagnose or
treat anyone.
Why this might work
A team at Georgia Tech and Meta built PressureVision, which estimates the pressure a hand
applies to a surface from a single RGB image [4]. The useful part, for me, is what their
camera does not see. It never sees the contact patch. It sees the back of the hand.
The model works because pressing changes how a hand looks from the outside. Tissue
deforms, blood moves out of the loaded region, the pose shifts, and shadows change. Those
small changes carry the signal. The team trained on 36 participants pressing an
instrumented surface. A later version, PressureVision++, reached 51 participants by using
weak labels taken from what each participant was asked to do [5].
A loaded foot does the same things. The arch flattens. The toes splay. The tissue under
the metatarsal heads bulges sideways. The heel pad spreads on contact. The shank angle
changes through stance. None of that requires seeing the sole.
So my hypothesis is that a foot is a harder version of a hand, not a different problem.
Why existing data cannot answer it
I looked for a dataset pairing video of feet with measured plantar pressure. The ones I
found use sensor insoles.
That is the difficulty. An insole goes inside a shoe. If the sensor sits under the foot,
the foot sits in a shoe, and the camera sees a shoe. This is not a flaw in one dataset. It
follows from where the sensor has to sit.
I checked one to be certain. The Insole-GAITRite dataset holds 22 participants and 794
clips of synchronized insole and video recording under a CC BY 4.0 licence [6]. The
pressure side is good: 32 channels per foot on a nominal 64 Hz time base. The video side
cannot answer my question. Participants wear shoes, the camera takes a room-level view,
and the feet sit small and distant in the frame.
That data can answer a different question, which is whether limb motion predicts loading.
It cannot answer the appearance question, because it contains no foot appearance.
So I have to record my own.
Getting the pressure labels
I need a pressure reading taken at the same moment as each video frame. What I can afford
decides how good that reading is. I have three versions of the setup, and I will use the
best one I can get.
| Tier | Setup | What one label is | Cost |
|---|---|---|---|
| A | Bare foot on a pressure mat, camera to the side | a dense pressure map | mat must be borrowed |
| B | Sensor insole strapped under a bare foot | 32 points per foot | $250–400 |
| C | Public datasets only | shod feet, room-level video | free |
Tier A copies the PressureVision setup most closely, and I want it. A school or university
biomechanics lab is the realistic way to reach a mat; buying one is not. One commercial
platform currently
lists at €8,500.
Tier B is the version I expect to run. A sensor insole strapped under a bare foot, sandal
style, keeps the foot itself bare and in view while still measuring load. It covers the
sole, but the sole is not what the camera was going to use anyway. The cost is that 32
points make a sparse label, so I would predict those 32 values rather than a dense map.
Tier C means I got neither. I would then train on public data, report a motion result
rather than an appearance result, and say plainly in the write-up that the original
question went untested.
I will state which tier I ran before I report any number.
The plan
1. Record the dataset
The camera sits on a tripod at foot height, off to one side, so the arch and the medial
border stay visible. A marker of known size sits in frame so I can read distances in
millimetres.
I will record these conditions, because they load different parts of the foot:
- quiet standing;
- walking at a comfortable pace;
- heel loading;
- forefoot loading; and
- weight shifted inward, then outward.
For each participant I will record foot length and width, body weight, height, age, and
sex. Weight matters most, since it sets the scale of the load.
Synchronization is the part most likely to go wrong quietly. I will start every recording
with a sharp, visible event that both systems catch, such as a firm heel tap, and I will
check the alignment on every clip instead of assuming one fixed offset holds.
I will not record anyone until the school has reviewed the plan. The
ISEF human-participant rules
require approval before non-exempt human research begins. I will not recruit anyone with
diabetes, neuropathy, an ulcer, or another foot condition.
2. Line up the camera and the sensor
The video and the pressure reading use different coordinates. I need them at the same
scale and orientation.
I will place AprilTags around the edge of the sensing area. AprilTags look a little like
QR codes, but their corners give exact reference points [7]. OpenCV uses them to
straighten the image, like a phone document scanner, and to convert pixels to millimetres
[8].
First I will calibrate the camera lens to remove its slight bending of the image. The tags
then correct the viewing angle. I will check the result against the heel and the widest
part of the forefoot, and I expect those reference points to agree within 5 mm.
The code and printable tags come from the
official AprilTag project, the
printable tag collection, and the
OpenCV project.
3. Train and test the model
I will start with the dullest possible model and make the real one earn its place.
The first baseline predicts the training-set average and ignores the image completely. Any
model that cannot beat it has learned nothing about pressure. The second baseline uses
only body weight and the condition label. Then comes a small convolutional model on the
cropped foot region, in the shape PressureVision used: an image encoder, then a head that
outputs the pressure values.
I split by participant, never by frame. Every clip from one person stays on one side of
the split. Frames from a single video look nearly identical, so splitting by frame would
let the model memorize a person and report an accuracy I could not reproduce on anyone
new. With a small number of participants I will use leave-one-subject-out.
I will report error against the baselines, not on its own. A number like “18% mean error”
means nothing until you know the mean predictor scored 31%.
One caution about units. A sensor that ships without a traceable calibration gives me
readings, not kilopascals. If I cannot calibrate it against known weights, I will report
values in the sensor’s own units and as a fraction of each participant’s peak, and I will
not print kPa on a chart to make it look more official than it is.
The model passes if it beats both baselines on held-out participants, and if the predicted
peak lands within 15 mm of the measured peak.
4. Design the insole
A lattice is a repeating network of small supports. Changing their size and thickness
changes how stiff the insole is.
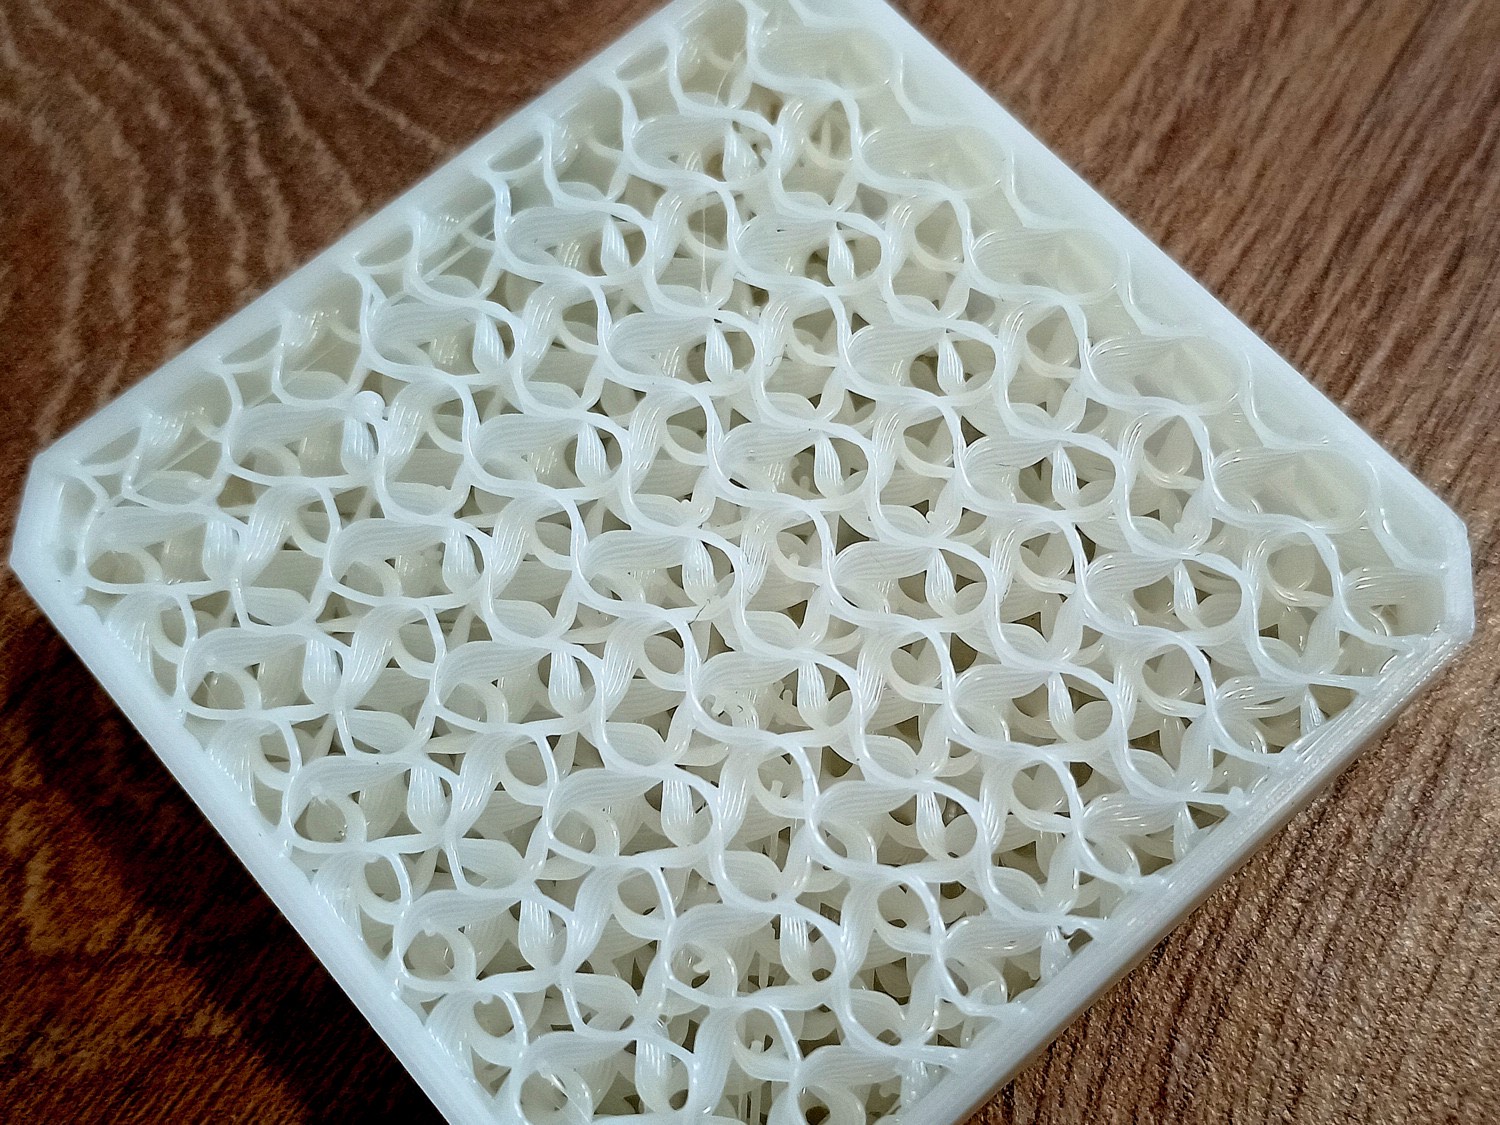
I will make the lattice more flexible below the hotspot. That area should sink slightly
and share load with the tissue around it. It could also just move the hotspot somewhere
else, so I will measure the surrounding area as well as the target.
Before printing an insole I will test small lattice blocks called coupons. I will make
four designs and five copies of each, load them with known weights, and measure how far
they compress. These tests matter because print direction, temperature, and wall thickness
all change how TPU behaves.
I will import the pressure map into nTop, which can vary a
lattice across a sole [9]. Limits on cell size and strut thickness will keep the soft
areas from collapsing and the thin parts printable.
I will print three insoles from the same foot shape:
- A solid insole, as a basic reference.
- A uniform insole with the same lattice everywhere.
- A custom insole whose lattice follows the predicted pressure map.
The uniform and custom insoles will share the same thickness and roughly the same amount
of TPU. Printer, filament, print direction, and slicer settings also stay the same.
5. Test the insole
Nobody will walk in the experimental insole. A rigid, 3D-printed foot and a guide apply
the same weight in the same place each time.
Pressure film between the test foot and the insole turns red when squeezed. Darker red
means higher pressure. Fujifilm sells this film in calibrated ranges, so this part of the
project does produce real pressure units. I will choose the film for the measured range
and hold loading time, room conditions, wait time, and scanner settings constant.
I will test each design five times in a mixed order. I will mark the hotspot and the
nearby comparison area before testing, so I cannot pick the best-looking area afterward.
For each trial I will record:
- the highest pressure in the original hotspot;
- the average pressure in that area;
- the size of the contact area; and
- the highest pressure just outside the hotspot.
The custom insole succeeds if it lowers the hotspot by at least 15% in four of five tests
and does not raise the nearby peak by more than 10%. I set these limits before testing.
What is core and what is not
Three months is not long, and my first version of this plan held too much. So I split the
project. The core covers the three questions and nothing else. Anything that makes the
result nicer rather than valid waits.
| Core, in the three months | Later, only if the core finishes |
|---|---|
| record the synchronized bare-foot dataset | multi-view phone capture and FOCUS 3D reconstruction [10] |
| baselines, then the pressure model | more participants and more loading conditions |
| leave-one-subject-out evaluation | a decision tree mapping pressure to lattice parameters |
| four lattice coupon designs | a wider sweep of geometries and TPU hardnesses |
| three insoles, five trials each | anything worn by a person |
Personalized 3D foot geometry is the clearest example of something I moved. FOCUS
reconstructs a foot mesh from ordinary phone photos and would make the final insole fit an
individual properly [10]. It also does nothing to answer whether video can estimate
pressure. So it waits, and the core test holds one printed foot shape constant.
A fair comparison
The two main insoles differ only in where the lattice is soft or stiff.
| What changes | What stays the same |
|---|---|
| solid, uniform, or pressure-based design | foot shape and test foot |
| lattice size and strut thickness by region | total weight and where it is placed |
| local stiffness | insole thickness and approximate amount of TPU |
| pressure below the test foot | printer, filament, print direction, and slicer settings |
| film type, scanner settings, and reading time |
I will save every photo, calibration image, model, print file, and result. I will drop a
trial only for a reason I set in advance, such as a slipped weight or torn film. The
record will still show the dropped trial and the reason.
Safety and limits
The mechanical part of this project uses weights, lattice coupons, and a printed foot.
Nobody needs to wear the insole.
The human part means recording bare feet, and that part needs review first. Approval comes
before any capture, not after. I will not recruit anyone with diabetes, neuropathy, an
ulcer, or another foot condition. I will keep faces out of frame, store recordings
locally, and check any frame showing a participant before it goes anywhere.
I will use eye protection, ventilation, and adult supervision when I cut materials, run
the 3D printer, and test loads.
This project measures a small number of people and a stationary test load. It cannot show
what happens during long-term walking or in medical care. A good result would justify more
testing. It would not show that the insole prevents ulcers or that it is ready for
patients.
Cost
I already have the smartphone, computer, school 3D printer, tripod, scale, and calipers,
so I do not count them here.
| Item | Planned cost |
|---|---|
| USB camera and mount | $40 |
| Backdrop, stand, and fixtures | $45 |
| TPU filament | $55 |
| Weights and calibration blocks | $25 |
| Pressure film | $70 |
| Printed tags and small supplies | $15 |
| Shared subtotal | $250 |
| Sensor insole, if Tier B | $250–400 |
| Total, Tier B | $500–650 |
Tier A adds nothing to this table, because a mat I cannot buy is a mat I have to borrow.
Tier C costs the shared subtotal alone.
The budget excludes nTop educational access. If I cannot get it, I will use an open-source
CAD program such as CadQuery.
Timeline
| Weeks | Work |
|---|---|
| 1–2 | safety and human-participant review; secure the pressure hardware; build the camera rig |
| 2–4 | baselines and the evaluation harness, using public data while approval is pending |
| 4–6 | record the synchronized bare-foot dataset |
| 6–8 | train the model; leave-one-subject-out testing against the baselines |
| 7–9 | print and compress the lattice coupons |
| 9–10 | design and print the three insoles |
| 11–12 | run the insole tests, analyze, and write up |
Weeks 2–4 deliberately overlap the approval wait. If approval runs slow, I am still
building the model harness, and the schedule absorbs it. If approval fails outright, I
drop to Tier C and say so.
Tools and guides
| Resource | What I need it for |
|---|---|
| PressureVision code | reference implementation for estimating pressure from RGB |
| PressureVision project page | method, dataset design, and the ++ follow-up |
| Insole-GAITRite dataset | synchronized insole and video recordings for early development |
| OpenCV | corrects the camera image and measures locations in it |
| AprilTag | finds the printed reference tags |
| Printable AprilTags | provides the tag images I will print |
| nTop shoe-sole guide | shows how a pressure map can control a lattice |
| CadQuery | open-source backup for making the insole geometry |
| FOCUS code | later stage: turns several foot photos into a 3D model |
| Fujifilm Prescale | explains the pressure film and its available ranges |
| ISEF rules and forms | explains the safety and approval requirements |
References
- Veves A, Murray HJ, Young MJ, Boulton AJM. “The risk of foot ulceration in
diabetic patients with high foot pressure: a prospective study.” Diabetologia.
1992;35(7):660–663. PubMed and
Europe PMC. - Bus SA, Armstrong DG, Crews RT, et al. “Guidelines on offloading foot ulcers in
persons with diabetes (IWGDF 2023 update).” Diabetes/Metabolism Research and
Reviews. 2024;40(3):e3647. DOI and
IWGDF guideline page. - Barr N, et al. “The use of computer-aided design and manufacture for foot orthoses: a
cross-sectional study of orthotic services in the UK.” Journal of Foot and Ankle
Research. 2025. DOI and
open-access text. - Grady P, Tang C, Brahmbhatt S, Twigg CD, Wan C, Hays J, Kemp CC. “PressureVision:
Estimating Hand Pressure from a Single RGB Image.” European Conference on Computer
Vision (ECCV). 2022. Paper,
code, and
conference talk. - Grady P, et al. “PressureVision++: Estimating Fingertip Pressure from Diverse RGB
Images.” IEEE/CVF Winter Conference on Applications of Computer Vision (WACV). 2024.
Project page. - “An Open Insole-Based Plantar Pressure Dataset at Varying Cadences Compared Against
GAITRite.” Zenodo, CC BY 4.0.
DOI. - Olson E. “AprilTag: A robust and flexible visual fiducial system.” IEEE
International Conference on Robotics and Automation (ICRA). 2011.
Paper and code. - Bradski G. “The OpenCV Library.” Dr. Dobb’s Journal of Software Tools. 2000.
OpenCV documentation and
source code. - nTop. “How to vary density to create a custom shoe sole.”
Official guide
and video. - Boyne O, Cipolla R. “FOCUS: Multi-View Foot Reconstruction from Synthetically
Trained Dense Correspondences.” International Conference on 3D Vision (3DV). 2025.
Paper,
project, and
code.